

Intraday Correlations and Volatility: A Primer
A educational primer for intraday trading using macro signals

Always Learning:
I started this Substack by writing an extensive suite of educational articles on every aspect of macro and markets. In any profession, you need to constantly learn and increase your level of competency in order to maintain your edge. Today, I want to add to these articles by explaining how correlations and implied volatility function as they directly connect to intraday mean reversion.
![[FREE] Educational Primers On Every Aspect Of Macro & Markets](https://substackcdn.com/image/fetch/$s_!tfas!,w_1300,h_650,c_fill,f_webp,q_auto:good,fl_progressive:steep,g_auto/https%3A%2F%2Fsubstack-post-media.s3.amazonaws.com%2Fpublic%2Fimages%2F69c49472-3d63-47f0-9b8c-2a682fa625f1_1024x1024.jpeg)
If you understand how correlations and implied volatility function, then you can have a higher degree of precision on the respective timeframe you are operating on.
Correlations In Macro:
Correlations are not just statistical artifacts—they are structural signals that map the transmission of macroeconomic impulses through asset classes. When macro conditions shift, correlations can often reprice faster than outright momentum, reflecting the reorganization of dominant drivers across growth, inflation, and liquidity. In this way, correlations are both an input into positioning and a mirror of regime structure. A clear example lies in the relationship between stocks and bonds, where the sign and magnitude of their correlation reflect the prevailing macro trade-off. There are four distinct stock-bond correlation regimes—each tied to the market’s perception of growth and inflation risk dominance:
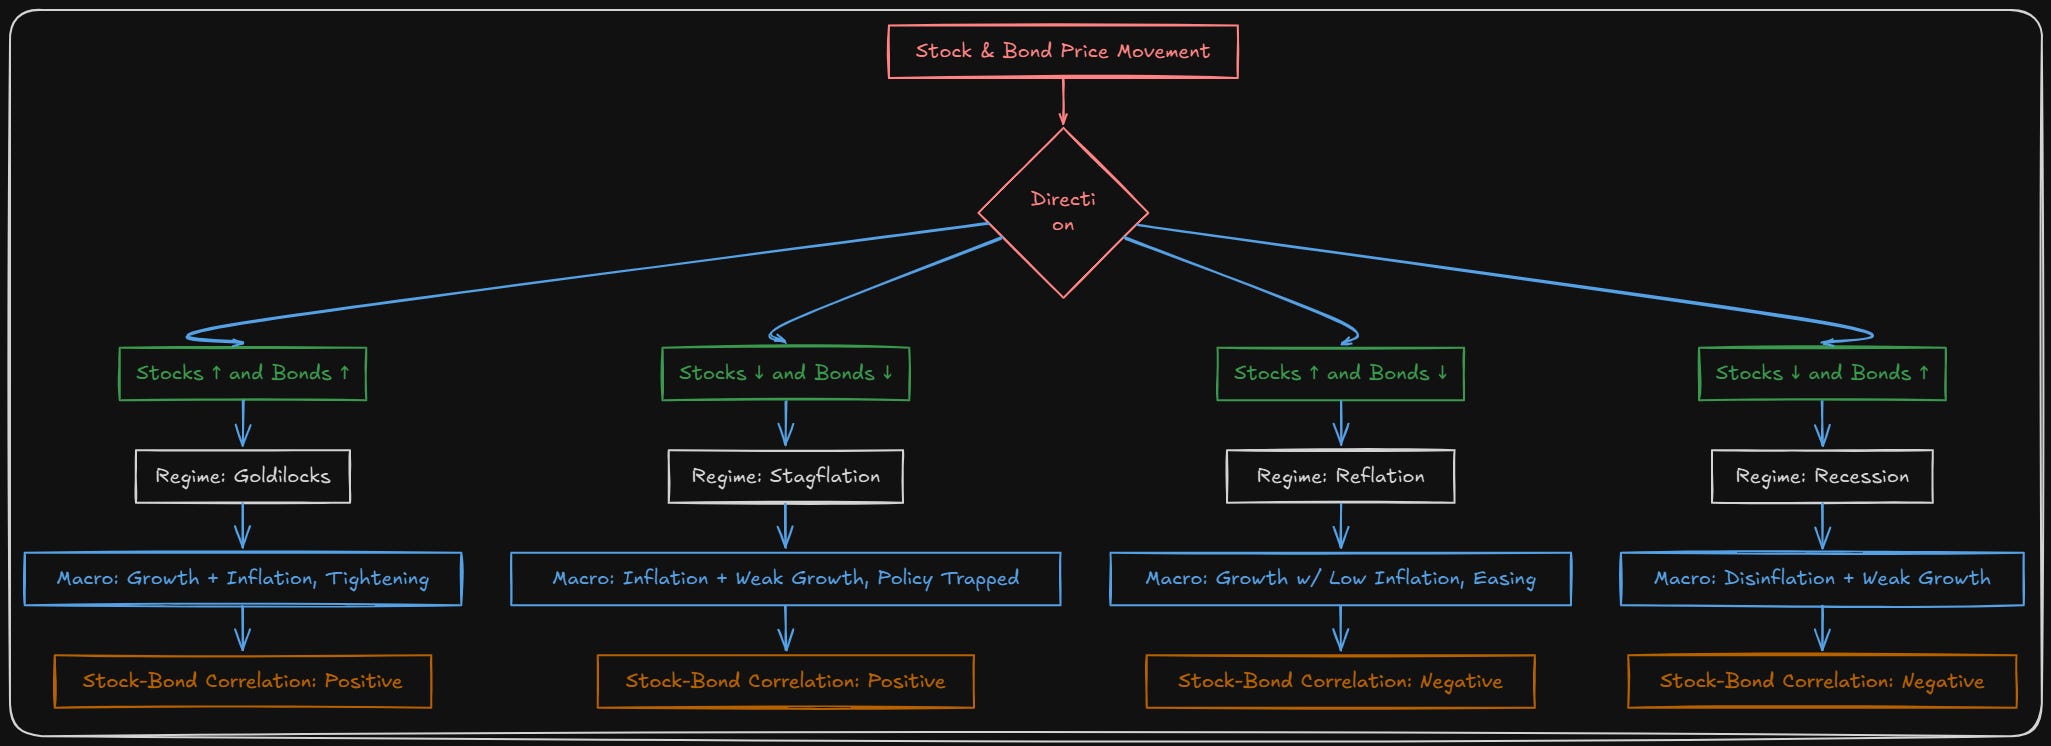
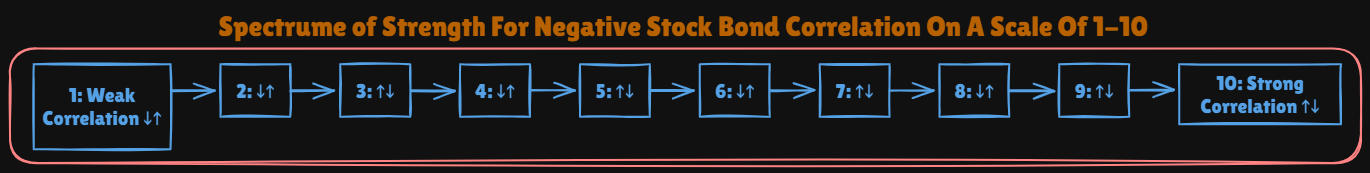
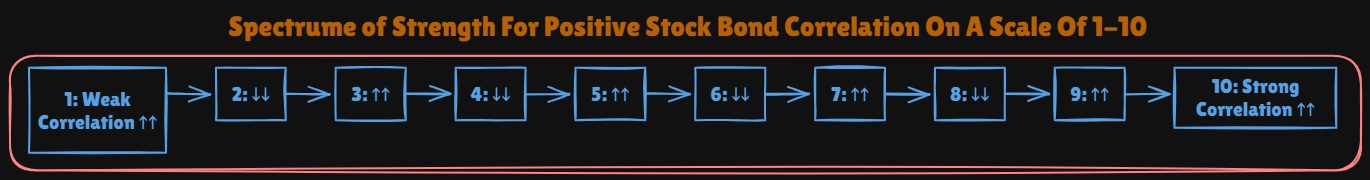
So we know there are 4 major regimes for the stock bond correlation. However, there are varying degrees of strength of these correlations (assuming lookback is held constant). After we know WHAT correlation regime we are in, then we want to know HOW STRONG it is.
After we establish WHAT the correlation is and HOW STRONG it is, we can connect this to implied volatility. I already laid out how to think about implied volatility in the positioning premium articles here:
Macro Alpha Primers:
Macro Alpha Primer: Credit Risk and Duration Risk and Macro Podcast: Macro Alpha Primer
Macro Alpha Primer: Correlations and Macro Podcast: Macro Alpha Primer
Macro Alpha Primer: Macro Catalysts, Hedging Pressure, and Positioning and Macro Podcast: Macro Alpha Primer
Macro Alpha Primer: Positioning Premiums and Macro Podcast: Macro Alpha Primer
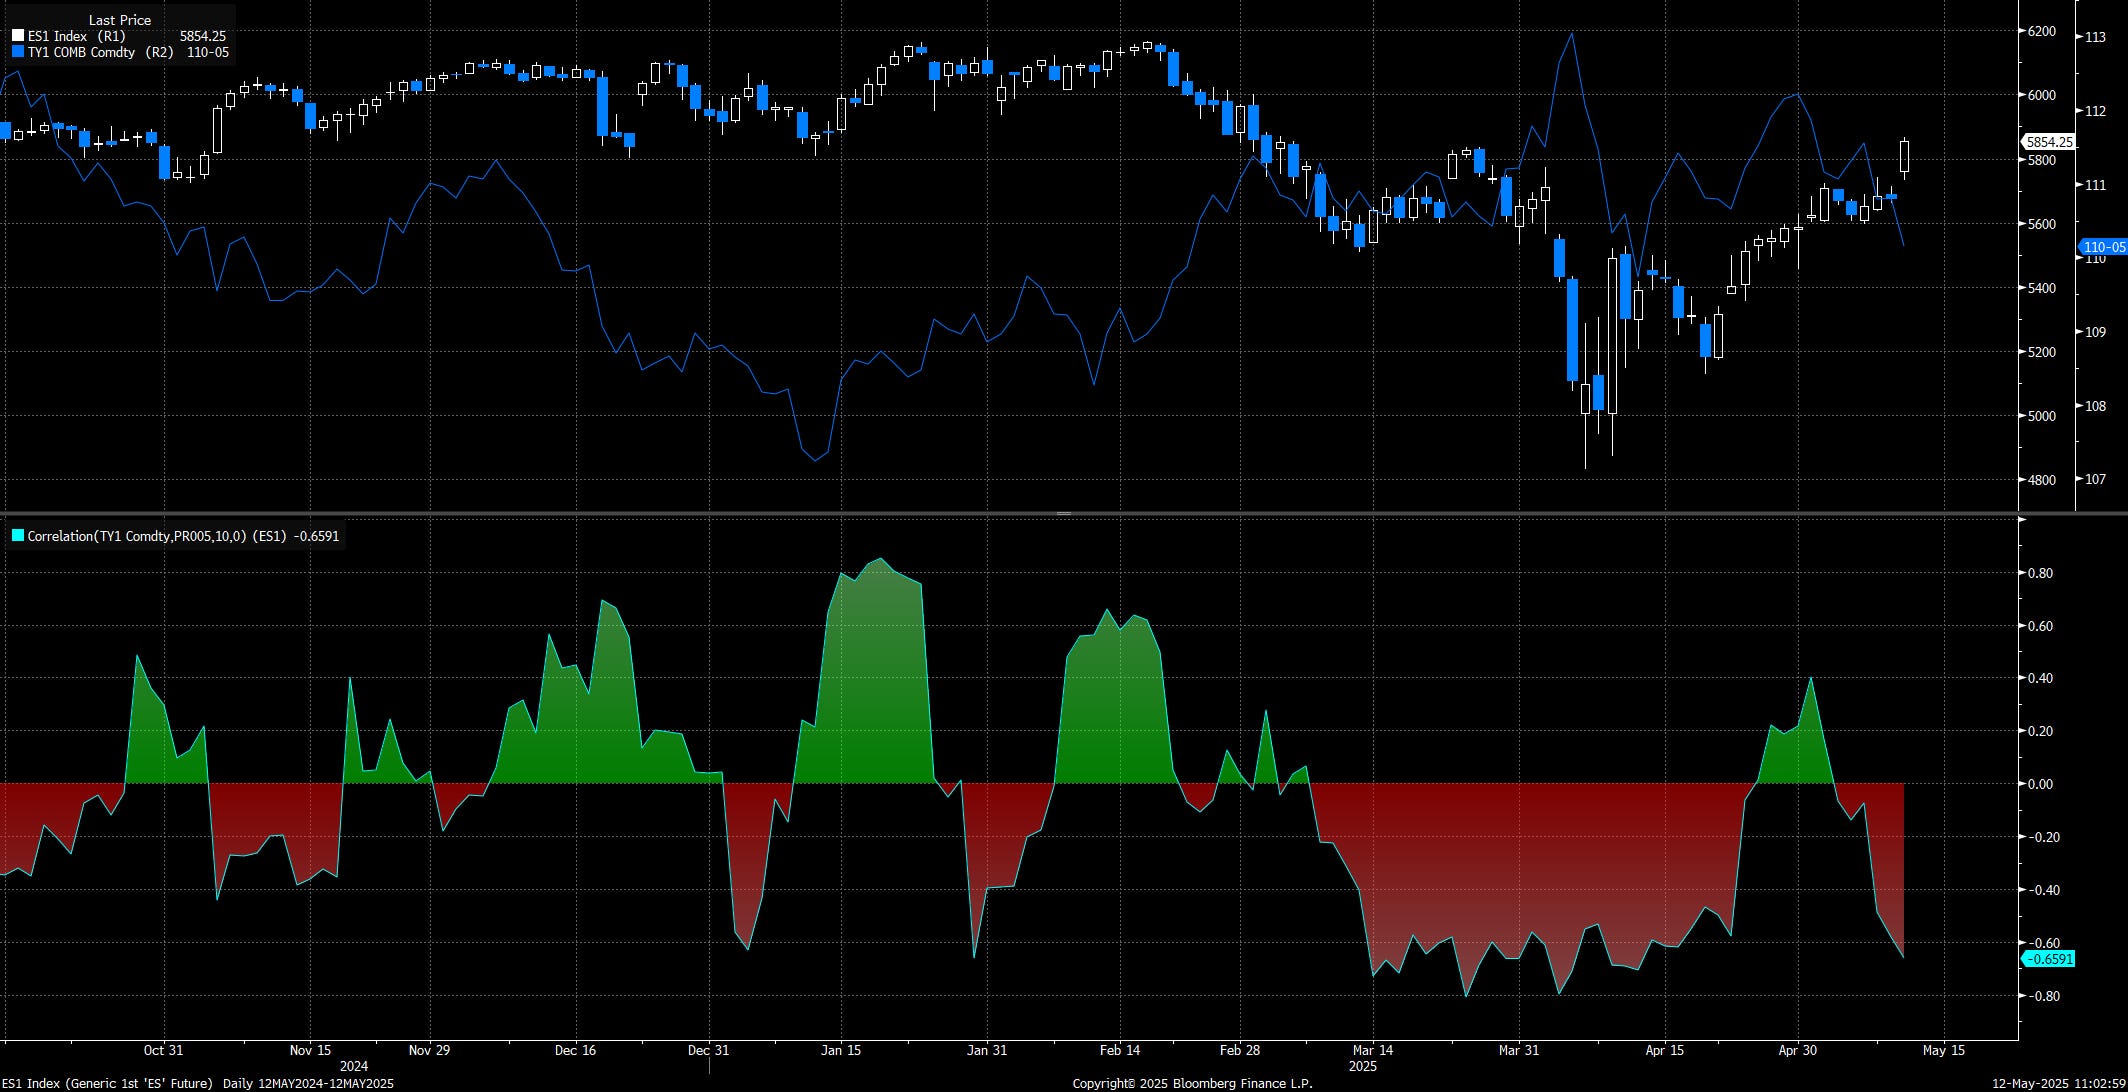
Let’s go through some tangible examples with the current macro regime. Let’s say I am trying to target opportunities on a weekly time horizon with daily execution. The chart below shows the correlation (lookback set to 10) between ES and ZN (TY1 in blue). You can see the correlation strength oscillates from green (positive stock bond correlation) to negative (negative stock bond correlation) with varying degrees of strength. We are currently in a negative stock bond correlation regime with equities rallying and bonds falling which indicates reflation (growth and inflation accelerating). Now there are many additional ways to be more precise in how we are decomposing the exact TYPE of regime that the market is pricing but for our purposes today, we will keep it simple.
From here we want to further refine our view of the correlation regime with implied volatility. The chart below shows the correlation as well as the VIX (equity vol) and MOVE Index (bond vol). Notice that the VIX and MOVE index were rallying during the previous negative stock-bond correlation (in April) but are now falling. This is important to note because when implied volatility is rising, it is an indication of hedging pressure and traders paying a premium for specific exposure on a tail. Digging into call or put skew in connection with these correlations is how you further refine WHY volatility is rising or falling with a specific correlation regime.
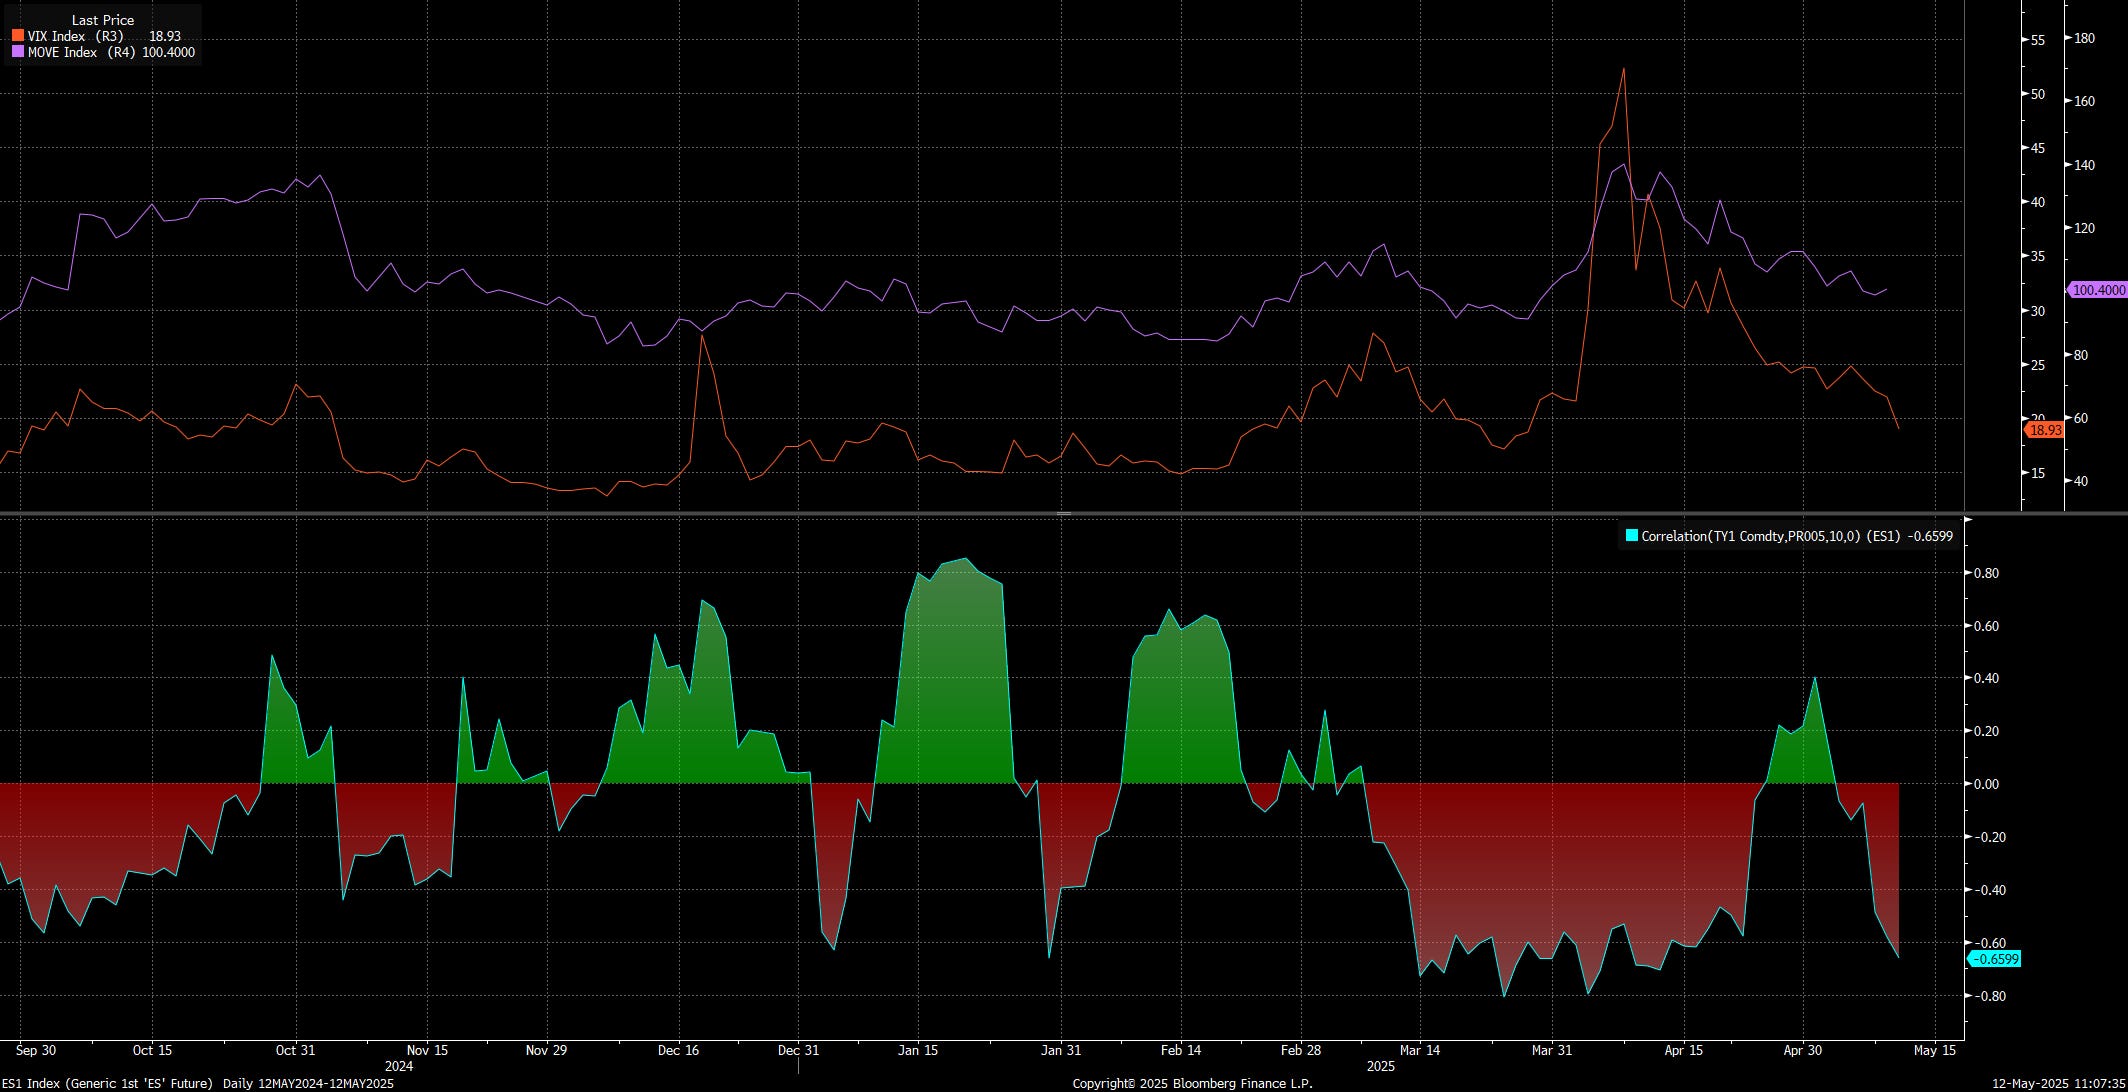
Typically, you will have capitulation in positioning when correlations go to an extreme AT THE SAME TIME implied volatility goes to an extreme. You want to map the volatility AND correlations together. Once you have a depiction of this, then you can begin connecting across various timeframes, like intraday.
Connecting To Price Action:
Fundamentally, a macro trend that takes place over a 2-3 month period can be broken down into weekly returns, correlations, and volatility changes. When you break these down further, we can connect them to the intraday mean reversion that takes place in assets. Intraday mean reversion functions as a liquidity provision mechanism. Execution takes place, moves the price, and then consolidation takes place. These represent premiums, discounts, and trade-offs that traders operate around to get positions on.

Michael H. has a great breakdown of this in the options space and betting on these distributions.

If you want to spend more time understanding the microstructure and mechanics of the market in this shorter-term timeframe, check out the following resources:
Trades, Quotes and Prices Book. Amazing book!
The following papers:
https://papers.ssrn.com/sol3/papers.cfm?abstract_id=2668277
https://papers.ssrn.com/sol3/papers.cfm?abstract_id=488422
https://papers.ssrn.com/sol3/papers.cfm?abstract_id=1712822
https://papers.ssrn.com/sol3/papers.cfm?abstract_id=2549739
https://papers.ssrn.com/sol3/papers.cfm?abstract_id=2878945
https://papers.ssrn.com/sol3/papers.cfm?abstract_id=569982
https://papers.ssrn.com/sol3/papers.cfm?abstract_id=1913982
https://papers.ssrn.com/sol3/papers.cfm?abstract_id=4259584
https://papers.ssrn.com/sol3/papers.cfm?abstract_id=3900141
https://papers.ssrn.com/sol3/papers.cfm?abstract_id=2852760
https://papers.ssrn.com/sol3/papers.cfm?abstract_id=3305277
https://papers.ssrn.com/sol3/papers.cfm?abstract_id=3687746
https://papers.ssrn.com/sol3/papers.cfm?abstract_id=1127744
https://papers.ssrn.com/sol3/papers.cfm?abstract_id=3551166
https://papers.ssrn.com/sol3/papers.cfm?abstract_id=675665
https://papers.ssrn.com/sol3/papers.cfm?abstract_id=741365
https://papers.ssrn.com/sol3/papers.cfm?abstract_id=3479741
https://papers.ssrn.com/sol3/papers.cfm?abstract_id=965674
https://papers.ssrn.com/sol3/papers.cfm?abstract_id=3497001
https://papers.ssrn.com/sol3/papers.cfm?abstract_id=241728
https://papers.ssrn.com/sol3/papers.cfm?abstract_id=988886
https://papers.ssrn.com/sol3/papers.cfm?abstract_id=1342228
https://papers.ssrn.com/sol3/papers.cfm?abstract_id=1787625
https://papers.ssrn.com/sol3/papers.cfm?abstract_id=1373762
https://papers.ssrn.com/sol3/papers.cfm?abstract_id=3714230
https://papers.ssrn.com/sol3/papers.cfm?abstract_id=229959
https://papers.ssrn.com/sol3/papers.cfm?abstract_id=2996221
https://papers.ssrn.com/sol3/papers.cfm?abstract_id=4320775
https://www.smallake.kr/wp-content/uploads/2015/11/SSRN-id2668277.pdf
https://ericbudish.org/wp-content/uploads/2022/06/Flow-Trading-June-23-2022.pdf
https://www.researchgate.net/publication/314510860_Effects_of_the_Limit_Order_Book_on_Price_Dynamics
https://www.readcube.com/articles/10.2139%2Fssrn.1914293
https://docs.lib.purdue.edu/cgi/viewcontent.cgi?article=3209&context=open_access_dissertations
https://hal.science/hal-00397652v3/document
https://epubs.siam.org/doi/10.1137/130911196
https://hughchristensen.com/papers/academic_papers/SSRN-id1499209.pdf
https://www.hindawi.com/journals/sp/2021/9949565/
https://www.nber.org/system/files/working_papers/w25855/w25855.pdf
https://mpra.ub.uni-muenchen.de/101684/2/MPRA_paper_101684.pdf
http://tesi.luiss.it/27169/1/701851_PECCHIARI_MATTEO.pdf
https://edoc.hu-berlin.de/bitstream/handle/18452/4997/57.pdf?sequence=1
https://hughchristensen.com/papers/academic_papers/SSRN-id1433488.pdf
https://www.sciencegate.app/document/10.2139/ssrn.2022650
https://www.tse-fr.eu/sites/default/files/medias/doc/wp/fit/10-147.pdf
https://www.unibocconi.eu/wps/wcm/connect/aff80f23-9082-4c33-8bba-5399f2c01efb/rindi.pdf?MOD=AJPERES
https://sciendo.com/article/10.2478/fiqf-2020-0004?tab=references
https://arxiv.org/pdf/1312.3349.pdf
https://davidpublisher.com/Public/uploads/Contribute/5b1a2dbbe1a79.pdf
https://papers.ssrn.com/sol3/papers.cfm?abstract_id=1108485
https://papers.ssrn.com/sol3/papers.cfm?abstract_id=1108485
https://papers.ssrn.com/sol3/papers.cfm?abstract_id=459000
https://papers.ssrn.com/sol3/papers.cfm?abstract_id=2238087
https://papers.ssrn.com/sol3/papers.cfm?abstract_id=956476
https://papers.ssrn.com/sol3/papers.cfm?abstract_id=1997092
https://papers.ssrn.com/sol3/papers.cfm?abstract_id=676564
https://onlinelibrary.wiley.com/doi/10.1111/agec.12642
https://www.researchgate.net/publication/228469567_Optimal_display_of_iceberg_orders
https://link.springer.com/article/10.1007/s10436-017-0304-1
https://www.researchgate.net/publication/228261446_Optimal_Dipslay_of_Iceberg_Orders
https://openaccess.city.ac.uk/id/eprint/17333/14/10.1007%252Fs10436-017-0304-1.pdf
https://www.readcube.com/articles/10.2139%2Fssrn.3074049
http://fmwww.bc.edu/repec/esLATM04/up.23536.1081939804.pdf
https://www.econstor.eu/bitstream/10419/266836/1/1100.pdf
Tangible Example Connecting The Dots:
Here is a chart of ES with TWAP and Rolling VWAP on it. ZN is overlaid (pink), and the stock bond correlation is in the bottom panel with the VIX.
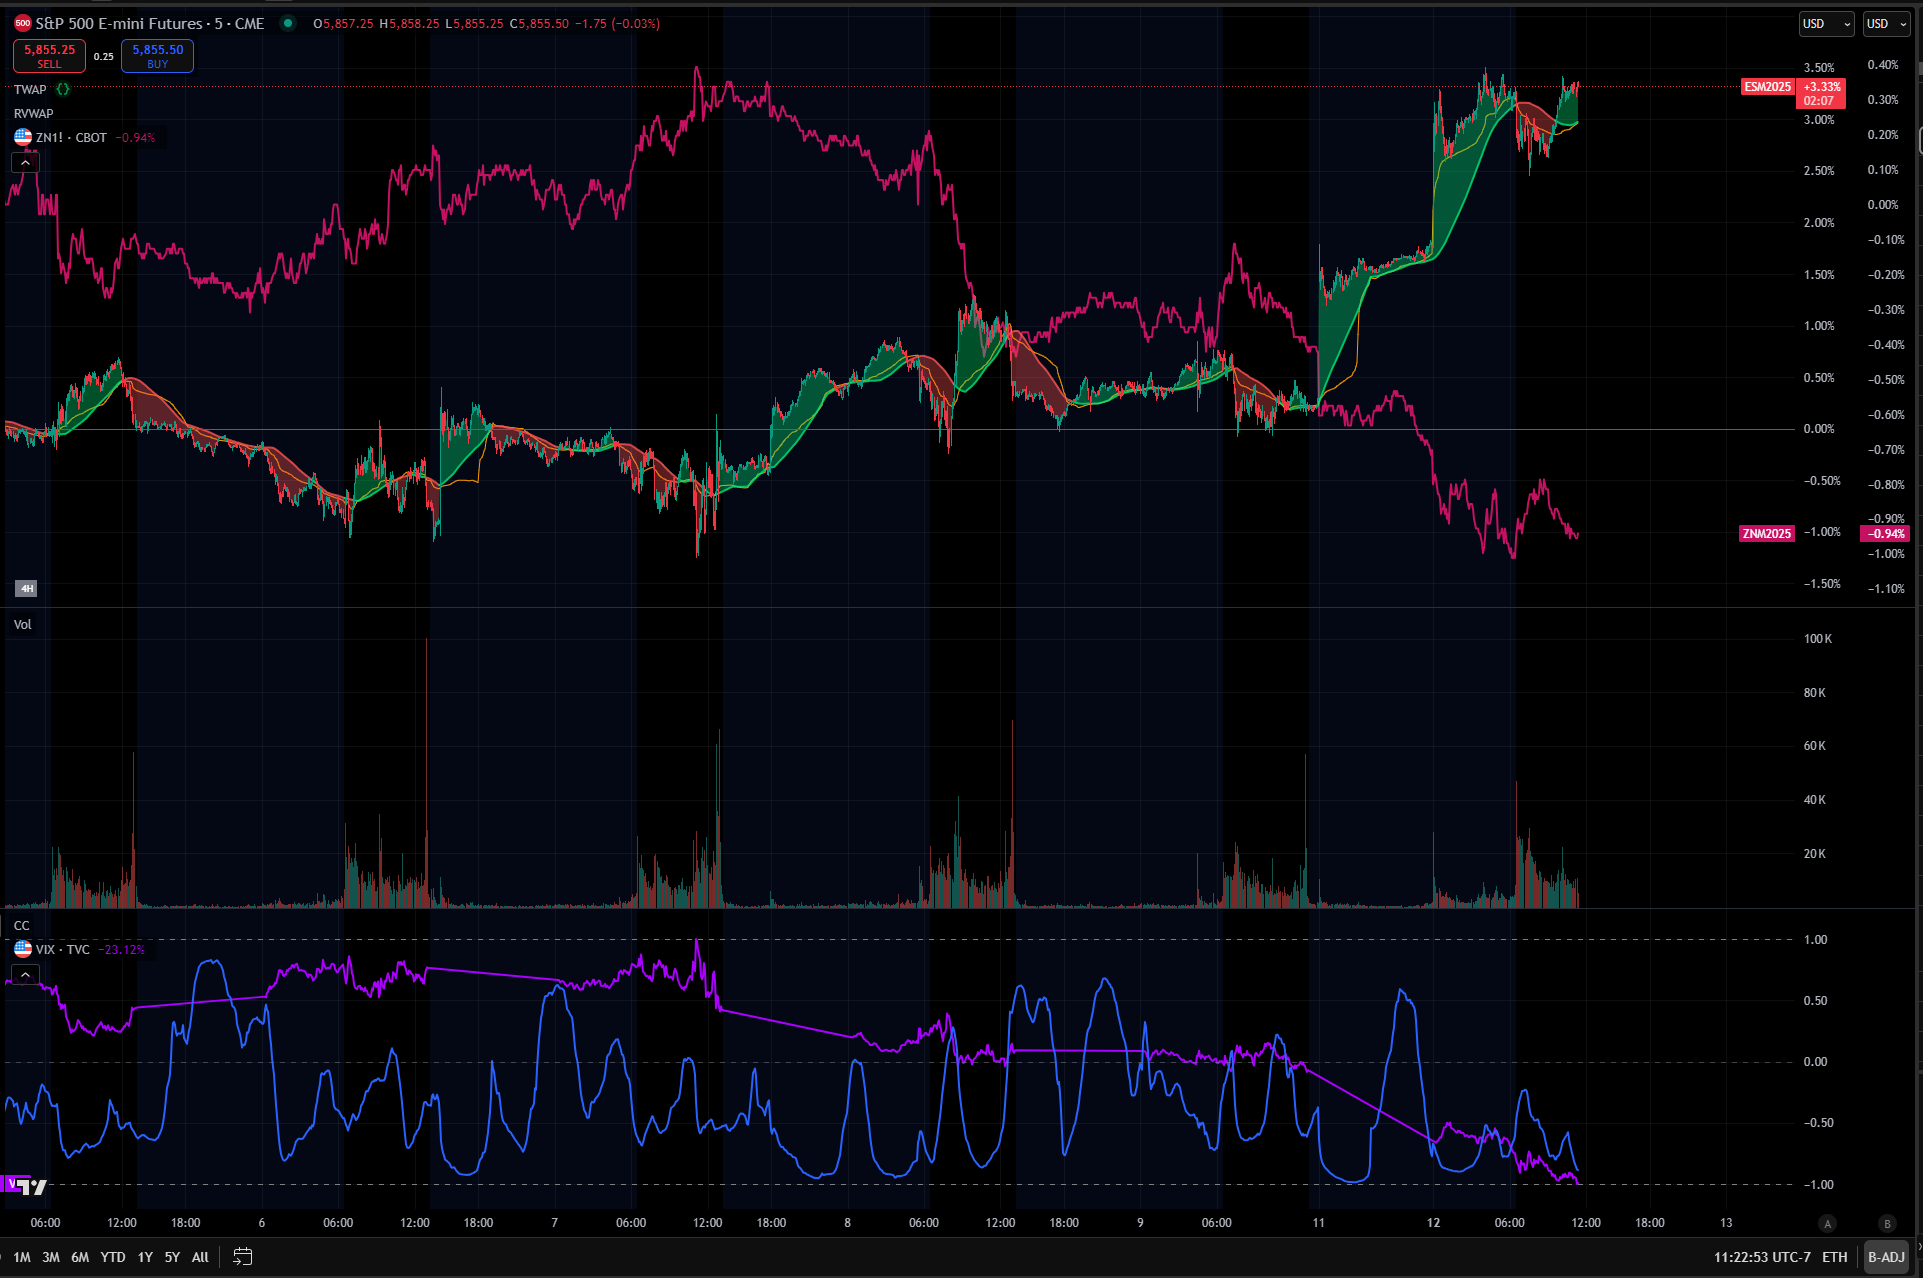
This is very VERY basic. In actuality, you need to decompose every part, get an exceptional understanding of it, model it independently, and then put everything back together so you have a whole that is greater than the sum of its parts.
The place to start is by breaking things into regimes. Ask yourself what TYPE of correlations are taking place, WHY they are taking place, HOW STRONG the correlations are, WHERE volatility is, and then connect this to the intraday mean reversion characteristics explained in the papers above.
I will just say, when you align all of these correctly on a systematic and discretionary basis, magic happens. I have spent a lot of time (and still do) trying to figure out what can and can’t be backtested. Once this becomes clearer, you can develop an edge and not compete against the quants.
If you felt like this article went over your head, feed the article into ChatGPT and have it explain it to you. Continue to develop your edge.

The information on this website/Substack is for information purposes only. It is believed to be reliable, but Capital Flows does not warrant its completeness or accuracy. The information on the website/Substack is not intended as an offer or solicitation for the purchase of stock or any financial instrument. The information and materials contained in these pages and the terms, conditions and descriptions that appear, are subject to change without notice. Unauthorized use of Capital Flows websites and systems including but not limited to data scraping, unauthorized entry into Capital Flows systems, misuse of passwords, or misuse of any information posted on a site is strictly prohibited. Your eligibility for particular services is subject to final determination by Capital Flows and/or its affiliates. Investment services are not bank deposits or insured by the FDIC or other entity and are subject to investment risks, including possible loss of principal amount invested. Your use of any information which is proprietary to Capital Flows or a third-party information provider shall only be used on individual devices without any right to redistribute, upload, export, copy, or otherwise transfer the information to any centralized interdepartmental or shared device, directory, database or other repository nor to otherwise make it available to any other entity/person/third party, without the prior written consent of Capital Flows.
Hi, I want to subscribe to the annual rate ($1.2k per year locked in), I sent you an email.
Tried to get the discounted rate but seeing 1750 still