

Macro Regime Tracker: Tariff Risk and Equities
Macro regime and risk assets qualified clearly

Macro Regime Tracker:
The Macro Regime Tracker offers a daily lens on how shifts in growth, inflation, and liquidity affect short-term risk and reward. Leveraging machine learning, AI, and cross-asset data, it identifies macro changes and their impact on market positioning.
You can find the video I recorded here that explains the new models and drivers (link)
Macro Regime Tracker Index:
Macro Regime Context
Macro Tear Sheets: Equities, Fixed Income, FX, Crypto, and Commodities
Macro Regime Dashboard: Excel spreadsheet for economic data and interest rates
Growth, Inflation, Fixed Income, Credit, and Equities Regime Tracker
AI and Machine Learning Strategies - Macro Regime and Positioning Premiums Strategies: S&P 500, 2-Year Interest Rates, Gold, and Bitcoin
Macro Regime Context:
When we have such wide ranges in risk assets, it is critical to maintain the big picture. I want to lay out the main structural forces and then connect them to the cyclical changes we are seeing and then zoom all the way down to the short-term levels in assets.
Main Idea: As we came into this year, it was clear that macro risks were beginning to shift. Positioning and consensus were offside as Trump took office, and everyone was extrapolating the “Trump economy” as equity valuations were at ATHs. There are two major forces to consider in this regime: 1) the political administration with tariff risk and 2) the Fed’s aggressiveness in cutting.
Remember, the Fed’s actions are the linchpin for all domestic liquidity. When inflation (blue and orange in chart below) is accelerating and ABOVE Fed Funds, capital rushes out the risk curve. Why? Because the market prices BOTH nominal and real risk, we typically only think of the world in nominal numbers. The situation we are at now is highly consequential because the Fed is holding rates above inflation.

The stance of the Fed, in addition to tariff risks, has put downward pressure on equities.

We know that the aggressiveness of cuts being priced in the forward curve is primarily a response to growth risks because inflation swaps continue to make new highs.

We now have almost 100bps of cuts priced for 2025:

This pricing of rates and negative price action in equities is in a regime where ADP came out above expectations, and NFP is expected to accelerate tomorrow.

The combination of the tariff risk and the Fed’s stance on accelerating inflation expectations is WHY the stock bond correlation has turned negative.

The main principle to think about when you have this type of drawdown is: The larger the drawdown, the greater the macro change that needs to take place in order to set a bottom. This is why the equity strategy has been short; underlying macro drivers and positioning premiums continue to skew equities to the downside. We have see short term bounces here and there, but overall, the risks driving equities down and bonds up have not reversed.
I will expand on these further in the strategy section.
Main Developments In Macro
*ECB ACCOUNT: BOTH A RATE CUT AND A PAUSE ARE ON TABLE FOR APRIL
*VANCE: WE'RE NOT GOING TO FIX THINGS OVERNIGHT
*LUTNICK: NEGOTIATING WITH ALL MAJOR COUNTRIES OF THE WORLD
*LUTNICK: INTEREST RATES IN THE US WILL BE MUCH LOWER
*LUTNICK: US TARIFFS WILL GO UP IF A COUNTRY RETALIATES
*US MARCH ISM SERVICES PMI AT NINE-MONTH LOW OF 50.8; EST. 52.9
*MACRON: ALL INSTRUMENTS ON THE TABLE TO RESPOND TO US TARIFFS
*LUTNICK: TRUMP WILL STAND FIRM
*TRUMP ON MARKET REACTION: IT'S GOING VERY WELL
*TRUMP: MARKET IS GOING TO BOOM
*TRUMP ON TARIFFS: WORLD LOOKING FOR WAYS TO MAKE A DEAL
*TRUMP: OPEN TO TARIFF NEGOTIATIONS IF SOMETHING 'PHENOMENAL'
*EU CONSIDERING FINING X MORE THAN $1B: NYT
Macro Tear Sheets: Equities, Fixed Income, FX, Crypto, and Commodities
Macro Regime Dashboard: Excel spreadsheet for economic data and interest rates
Growth, Inflation, Fixed Income, Credit, and Equities Regime Tracker
The Macro Regime Model offers a real-time view of growth, inflation, and yield curve dynamics, integrating these with credit market shifts, equity risk premiums, and positioning data. It connects upcoming catalysts to statistical drivers of asset prices, creating a unified framework that quantifies skew and clarifies risk-reward across asset classes.
Key Points:
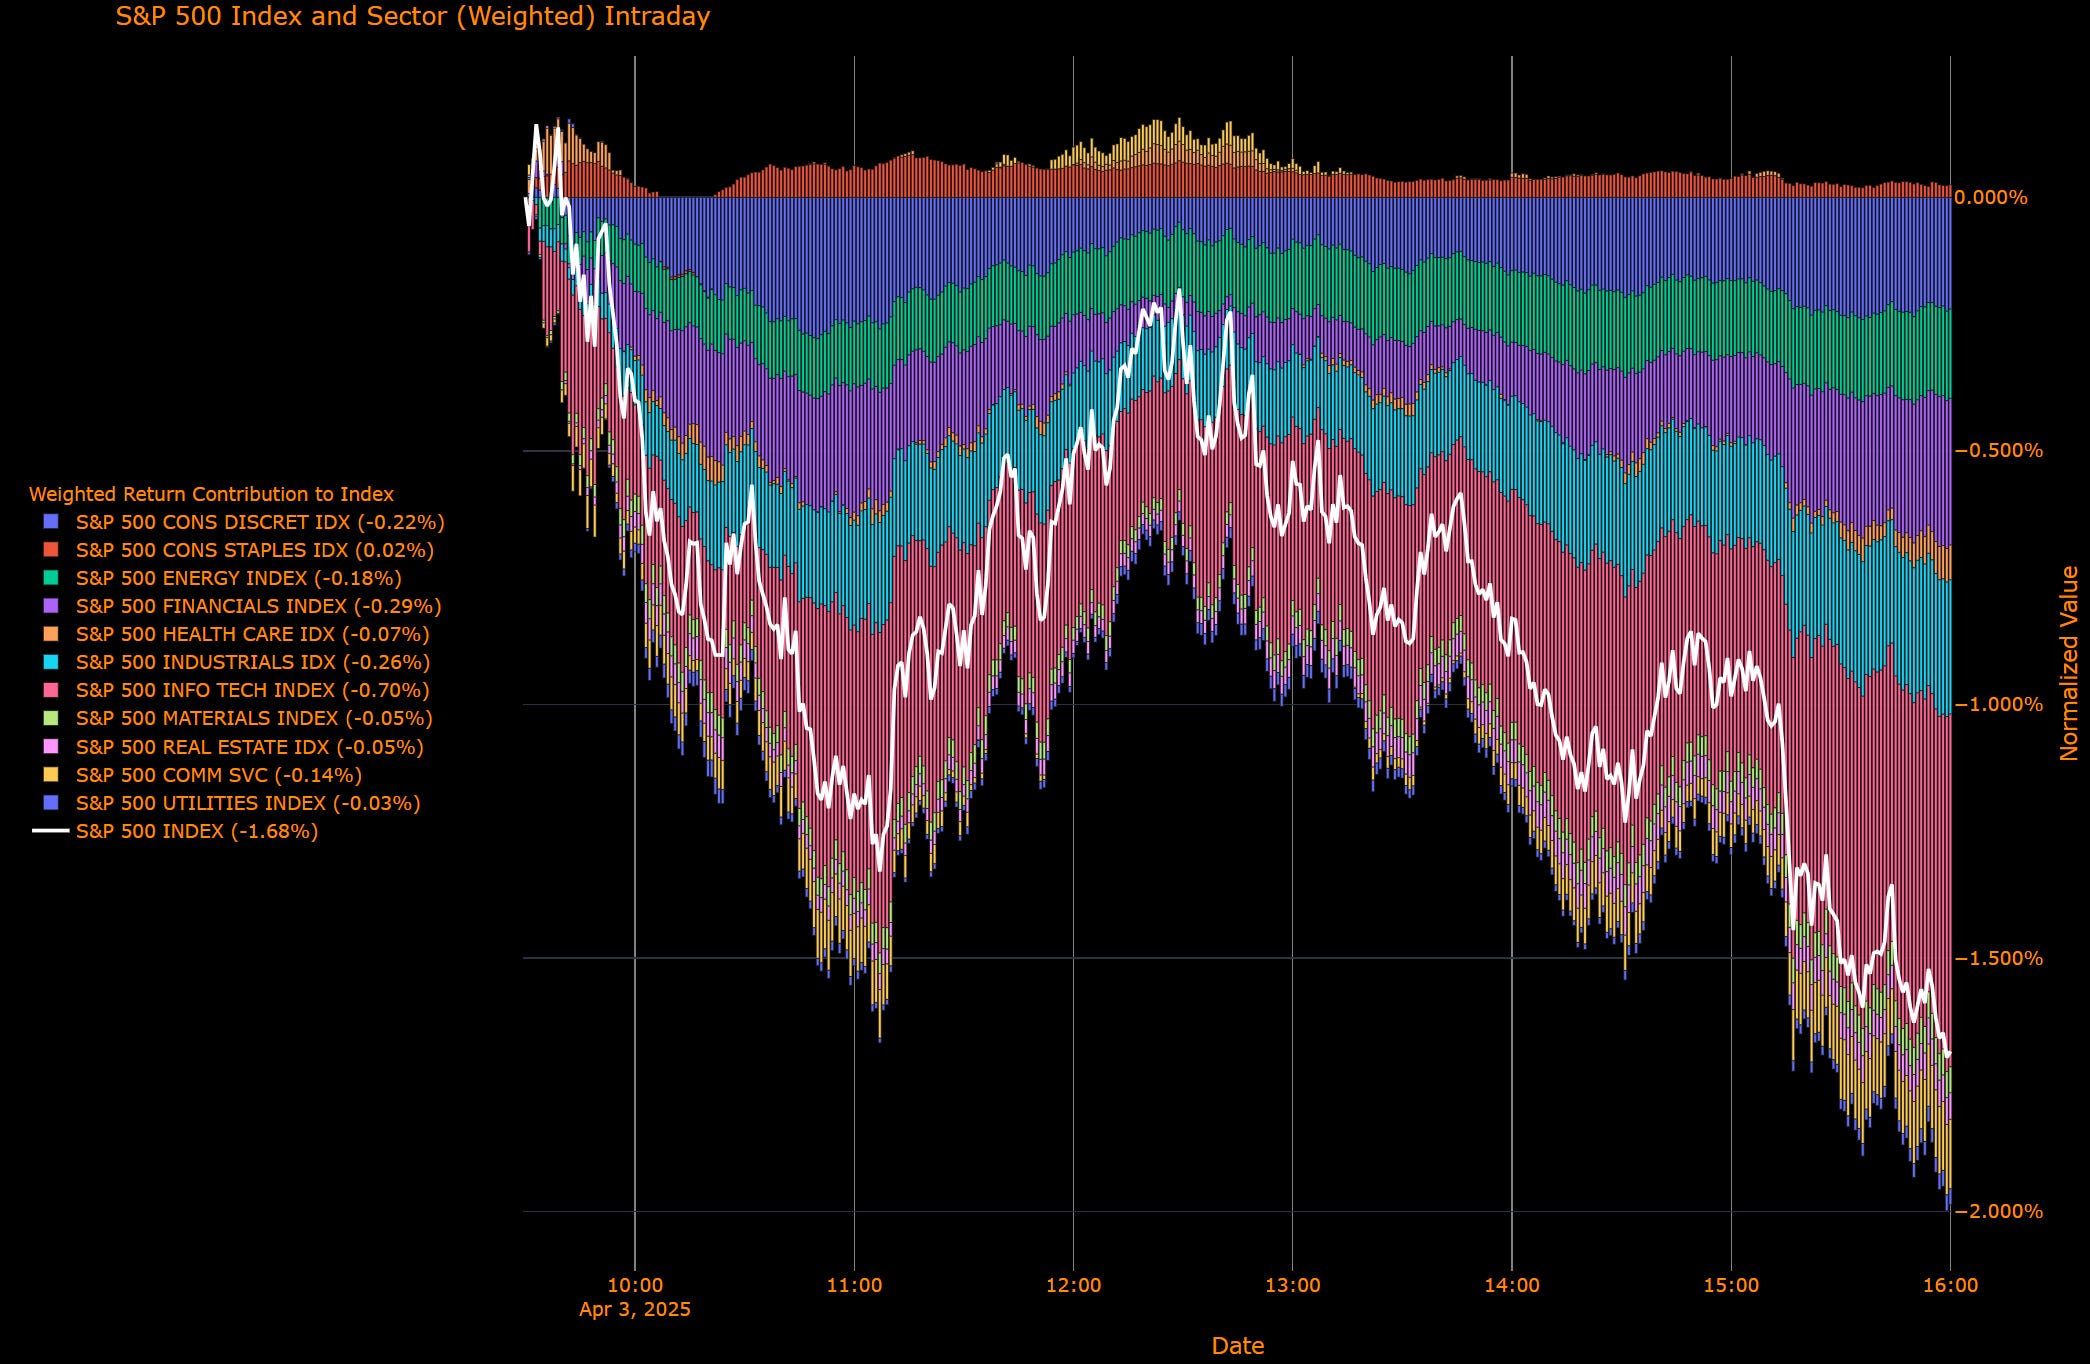
S&P 500 Intraday – Full-Blown Risk-Off (weighted basis)
The index closed down -1.68%, with weakness broad, persistent, and mechanical. Info Tech (-0.70%), Financials (-0.29%), and Industrials (-0.26%) were the heaviest drags, accounting for nearly 75% of the move. Tech alone took out ~40% of the day's loss clear signpost of high-beta exposure coming off.
No rotation into defensives. Staples (+0.02%), Healthcare (-0.07%), Utilities (-0.03%) all basically flat. There’s no shelter being sought — this is position unwinding across the board.
This is not rotation, this is risk reduction.
Broad-based, methodical selling, no single-sector unwind, no panic just consistent deleveraging.
S&P 500 Intraday – Broad Capitulation, Led by Cyclical Bloodbath (Unweighted)
The S&P 500 closed -1.68%, but under the hood, the damage was far worse. What looked like a moderate index decline masked full-blown cyclical carnage:
Biggest Hitters – Classic Growth & Cyclical Pain
Energy -4.97% → Brutal washout. Linked to oil weakness, but also reflects position de-risking amid rising recession odds.
Industrials -3.13%, Materials -2.51%, Discretionary -2.13% → All screaming slowdown. These are the sectors that catch macro air pockets first this is textbook growth scare behavior.
Info Tech -2.39%, Financials -1.98%, Real Estate -2.26% → The largest index contributors were uniformly smashed, confirming this is not a rotation but full de-grossing.
No Safety in “Safe”
Utilities -1.18%, Healthcare -0.60%, Comm Services -1.49% → Even defensives were sold. This wasn't a growth-to-defensive pivot this was a cash bid.
Staples +0.38% → The lone green sector. A weak bid for classic defensives, but too minor to offset the wave of selling elsewhere.

S&P 500 – Sector Breadth on 20D / 50D Horizons: Rotation Fades, Breadth Weakens
Today’s sector breadth shows a sharp deterioration in participation,this selloff was deep and wide, pointing to real de-risking rather than a sector-specific unwind.

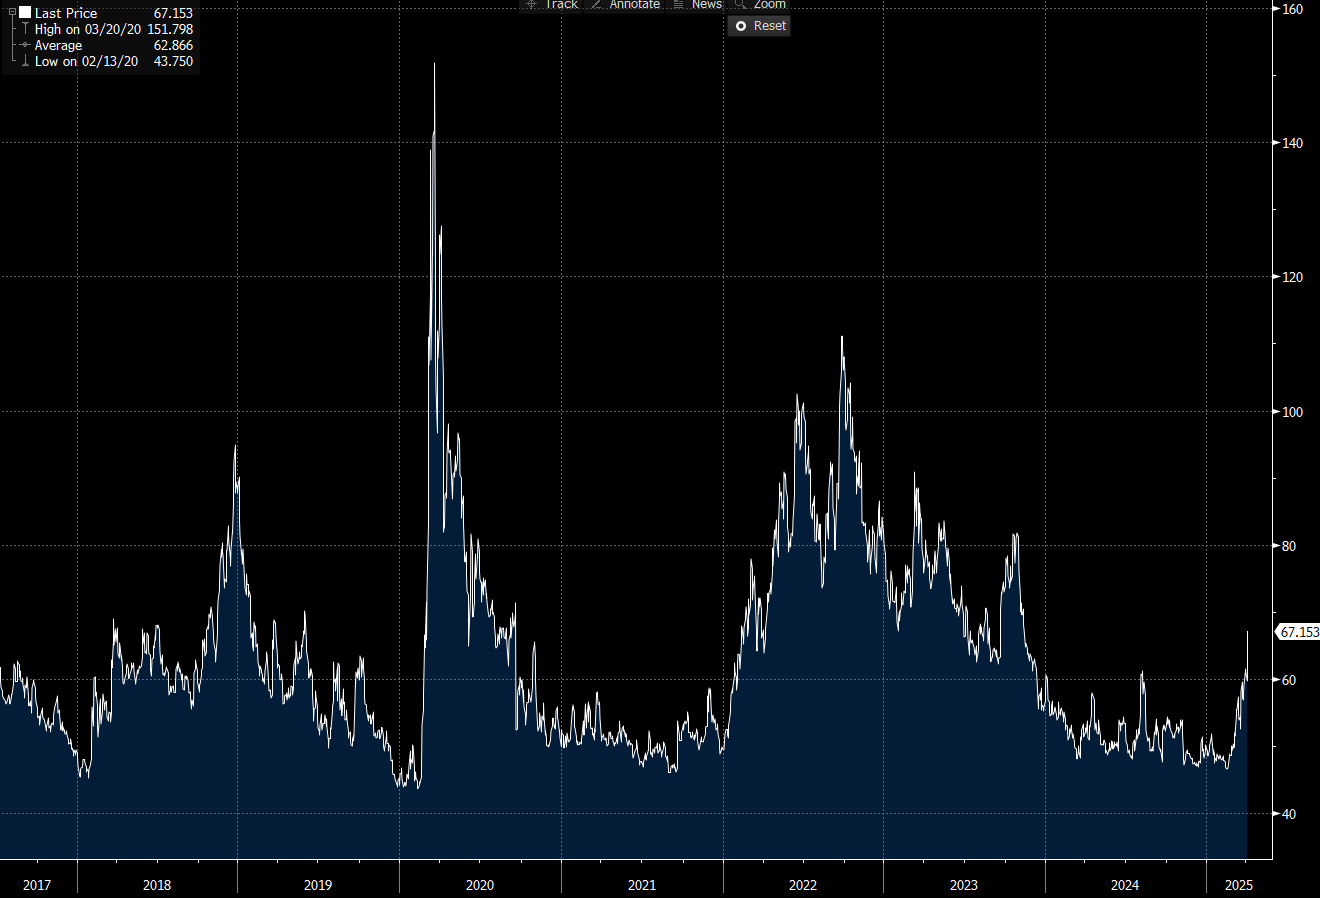
Credit Starting To Show Its Hand
The recent move higher in this credit measure is hard to ignore now pushing above 67, it's a clear break from the subdued levels that have persisted through most of late 2023 and early 2024. This jump signals rising stress in credit markets, consistent with a broader risk-off tone across assets. Notably, it's the sharpest move since early 2023, suggesting that liquidity is tightening, and investors are beginning to demand higher compensation for credit risk.
Combined with the tariff enduced broad equity sell off, the message is clear: macro risk is re-pricing and credit is starting to speak the same language as rates and equities.
Macro Regime and Positioning Premiums - Strategies:

Equities (ES)
==================================================
Technical Levels for ES1 Index (Date: 2025-04-04)
==================================================
Daily Range: 56.44
Resistance Levels (Above Open):
------------------------------
R5: 5539.90 | Offset: +116.90
R4: 5526.80 | Offset: +103.80
R3: 5453.67 | Offset: + 30.67 *
R2: 5444.33 | Offset: + 21.33 *
R1: 5425.92 | Offset: + 2.92 *
------------------------------
Open Price: 5423.00
------------------------------
Support Levels (Below Open):
------------------------------
S1: 5398.17 | Offset: - 24.83 *
S2: 5388.83 | Offset: - 34.17 *
S3: 5370.42 | Offset: - 52.58 *
S4: 5319.20 | Offset: -103.80
S5: 5231.22 | Offset: -191.78
* Denotes intraday level, likely tested
In the top panel, the total impulse of macro drivers and positioning is illustrated in its strength. The greater the strength in the move, the higher the probability and amplitude of the move that is likely to take place. The bottom panel illustrates if the skew is either bullish or bearish probability.

The next three charts show the underlying contribution for the Total Macro and Positioning Drivers in the chart above. These allow you to see the WHY behind moves.
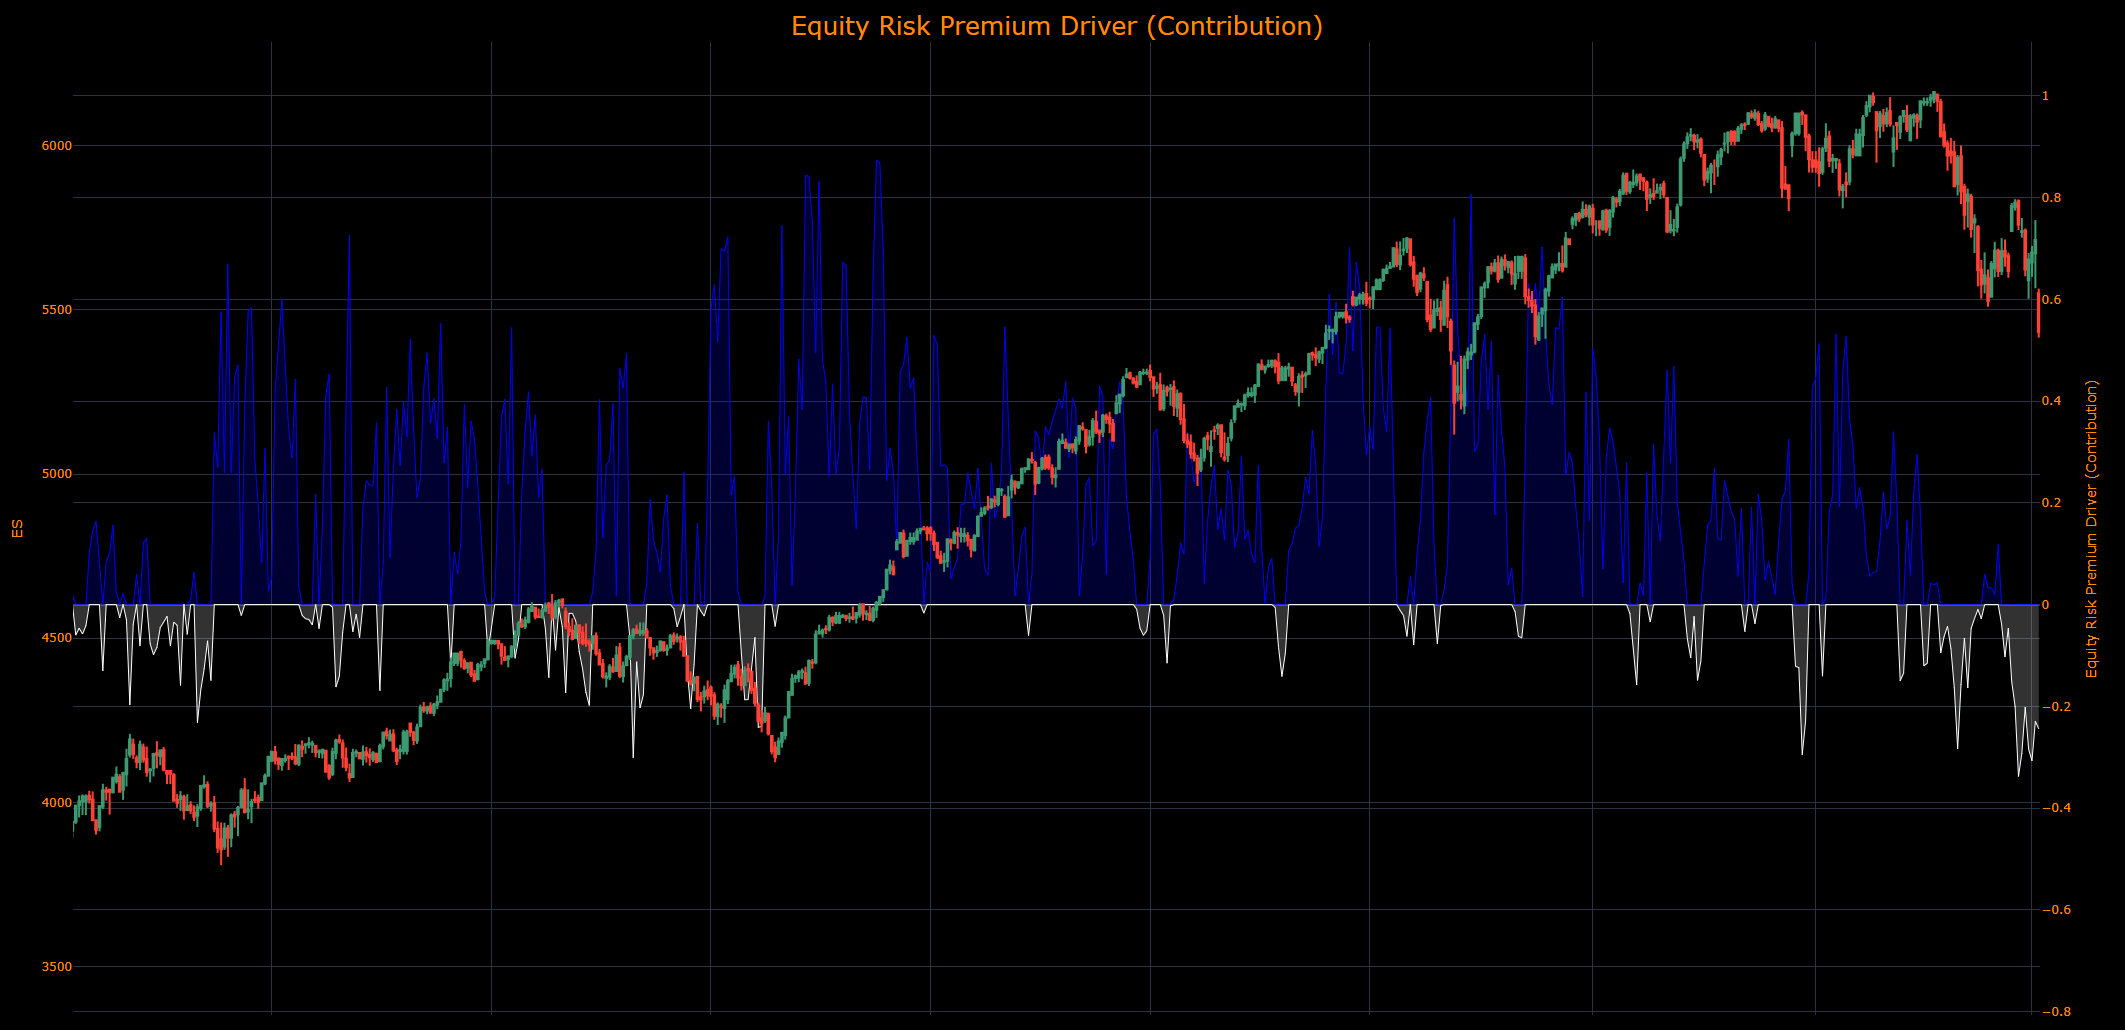
The Equity Risk Premium contribution aggregates major macro factors and the strength of factors driving equity risk premiums. In the same manner, the higher the contribution moves, the more strength the drivers have in pushing the index in a specific direction.
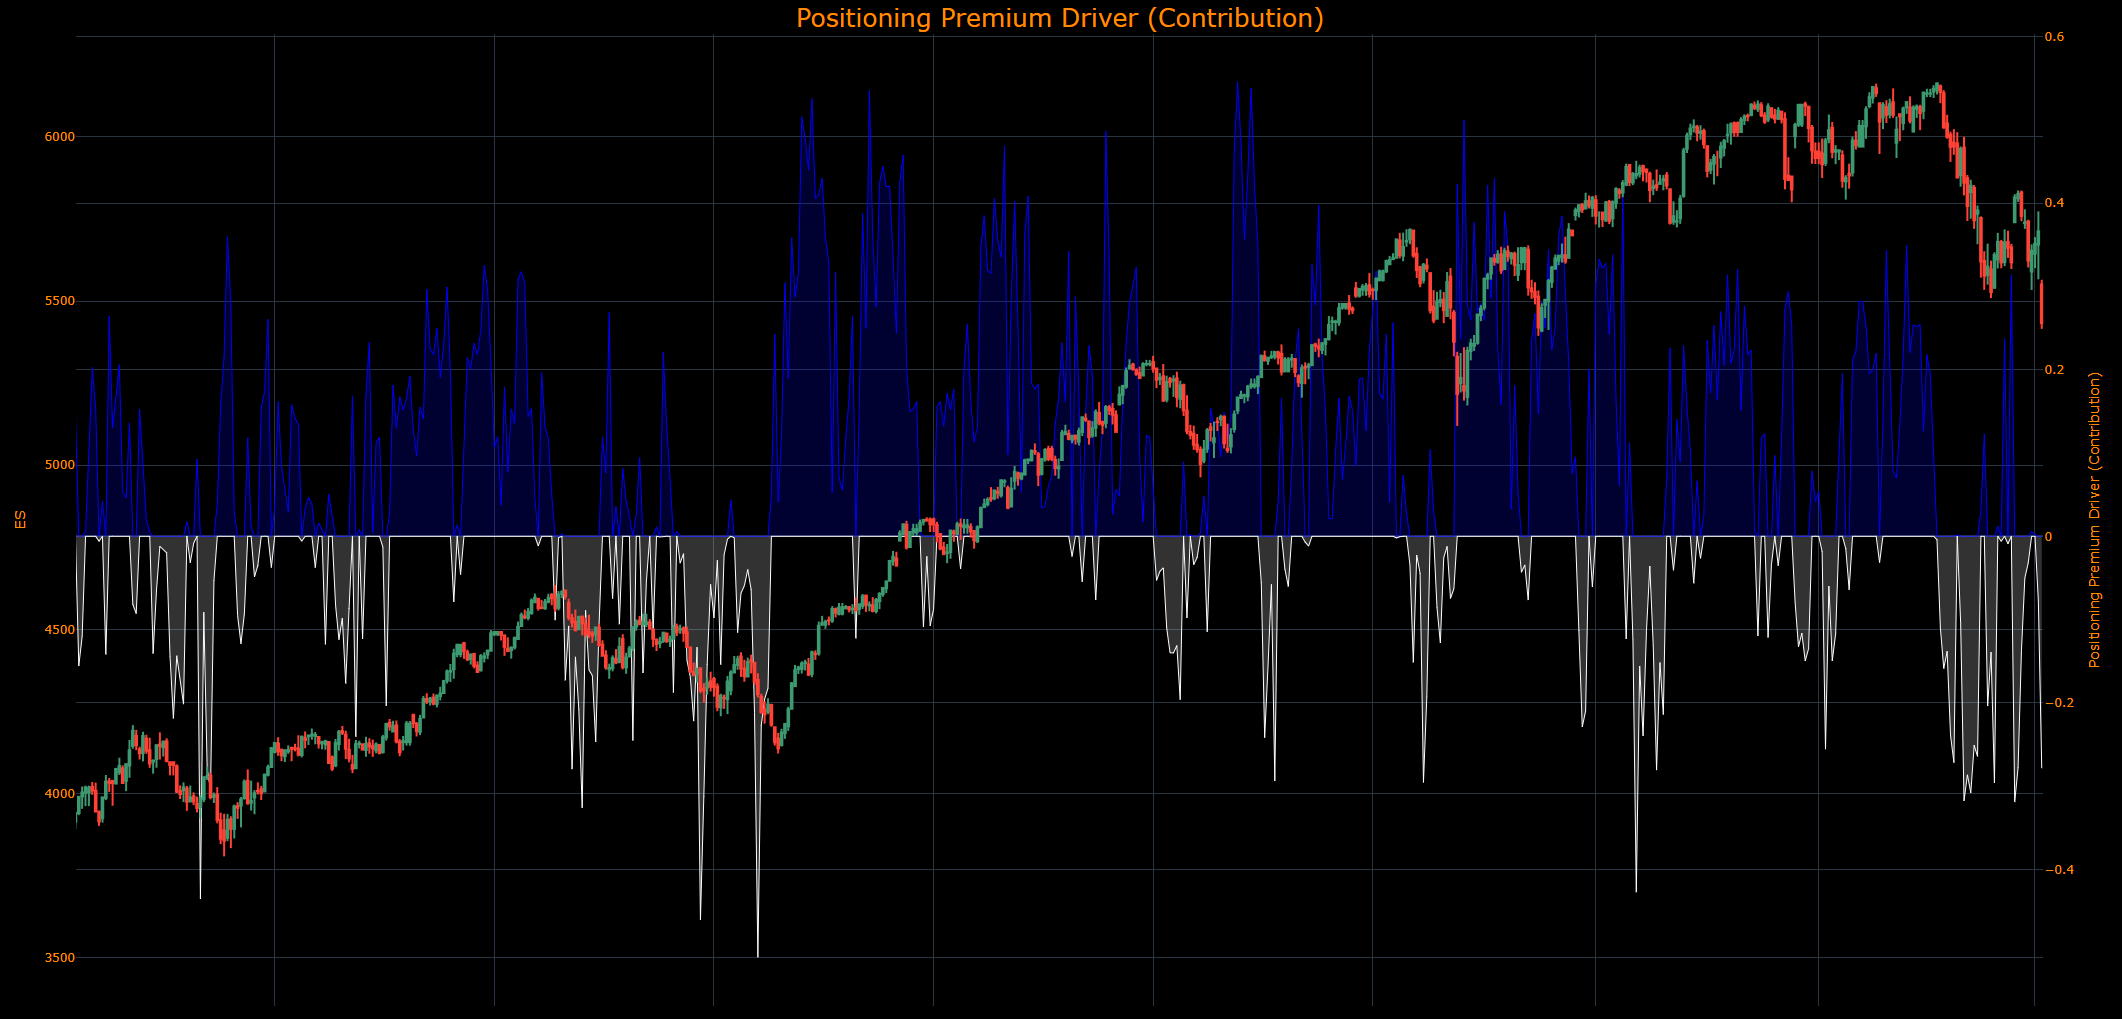
The Positioning Premium Driver contribution identifies HOW the drivers of positioning are contributing to equity returns. In the same manner, the higher the contribution moves, the more strength the drivers have in pushing the index in a specific direction.
The Growth Risk Premium Driver contribution identifies HOW the drivers of growth are contributing to equity returns. In the same manner, the higher the contribution moves, the more strength the drivers have in pushing the index in a specific direction.

2-Year Interest Rate
==================================================
Technical Levels for USGG2YR Index (Date: 2025-04-04)
==================================================
Daily Range: 0.04
Resistance Levels (Above Open):
------------------------------
R5: 3.84 | Offset: + 0.16
R4: 3.77 | Offset: + 0.09
R3: 3.76 | Offset: + 0.08
R2: 3.72 | Offset: + 0.04 *
R1: 3.71 | Offset: + 0.02 *
------------------------------
Open Price: 3.68
------------------------------
Support Levels (Below Open):
------------------------------
S1: 3.68 | Offset: - 0.00 *
S2: 3.63 | Offset: - 0.05
S3: 3.62 | Offset: - 0.07
S4: 3.60 | Offset: - 0.08
S5: 3.59 | Offset: - 0.09
==================================================
* Denotes intraday level, likely tested
In the top panel, the total impulse of macro drivers and positioning is illustrated in its strength. The greater the strength in the move, the higher the probability and amplitude of the move that is likely to take place. The bottom panel illustrates if the skew is either bullish or bearish probability.

The Inflation Risk Premium Driver contribution identifies HOW the drivers of inflation expectations are contributing to 2-year returns. In the same manner, the higher the contribution moves, the more strength the drivers have in pushing rates in a specific direction.

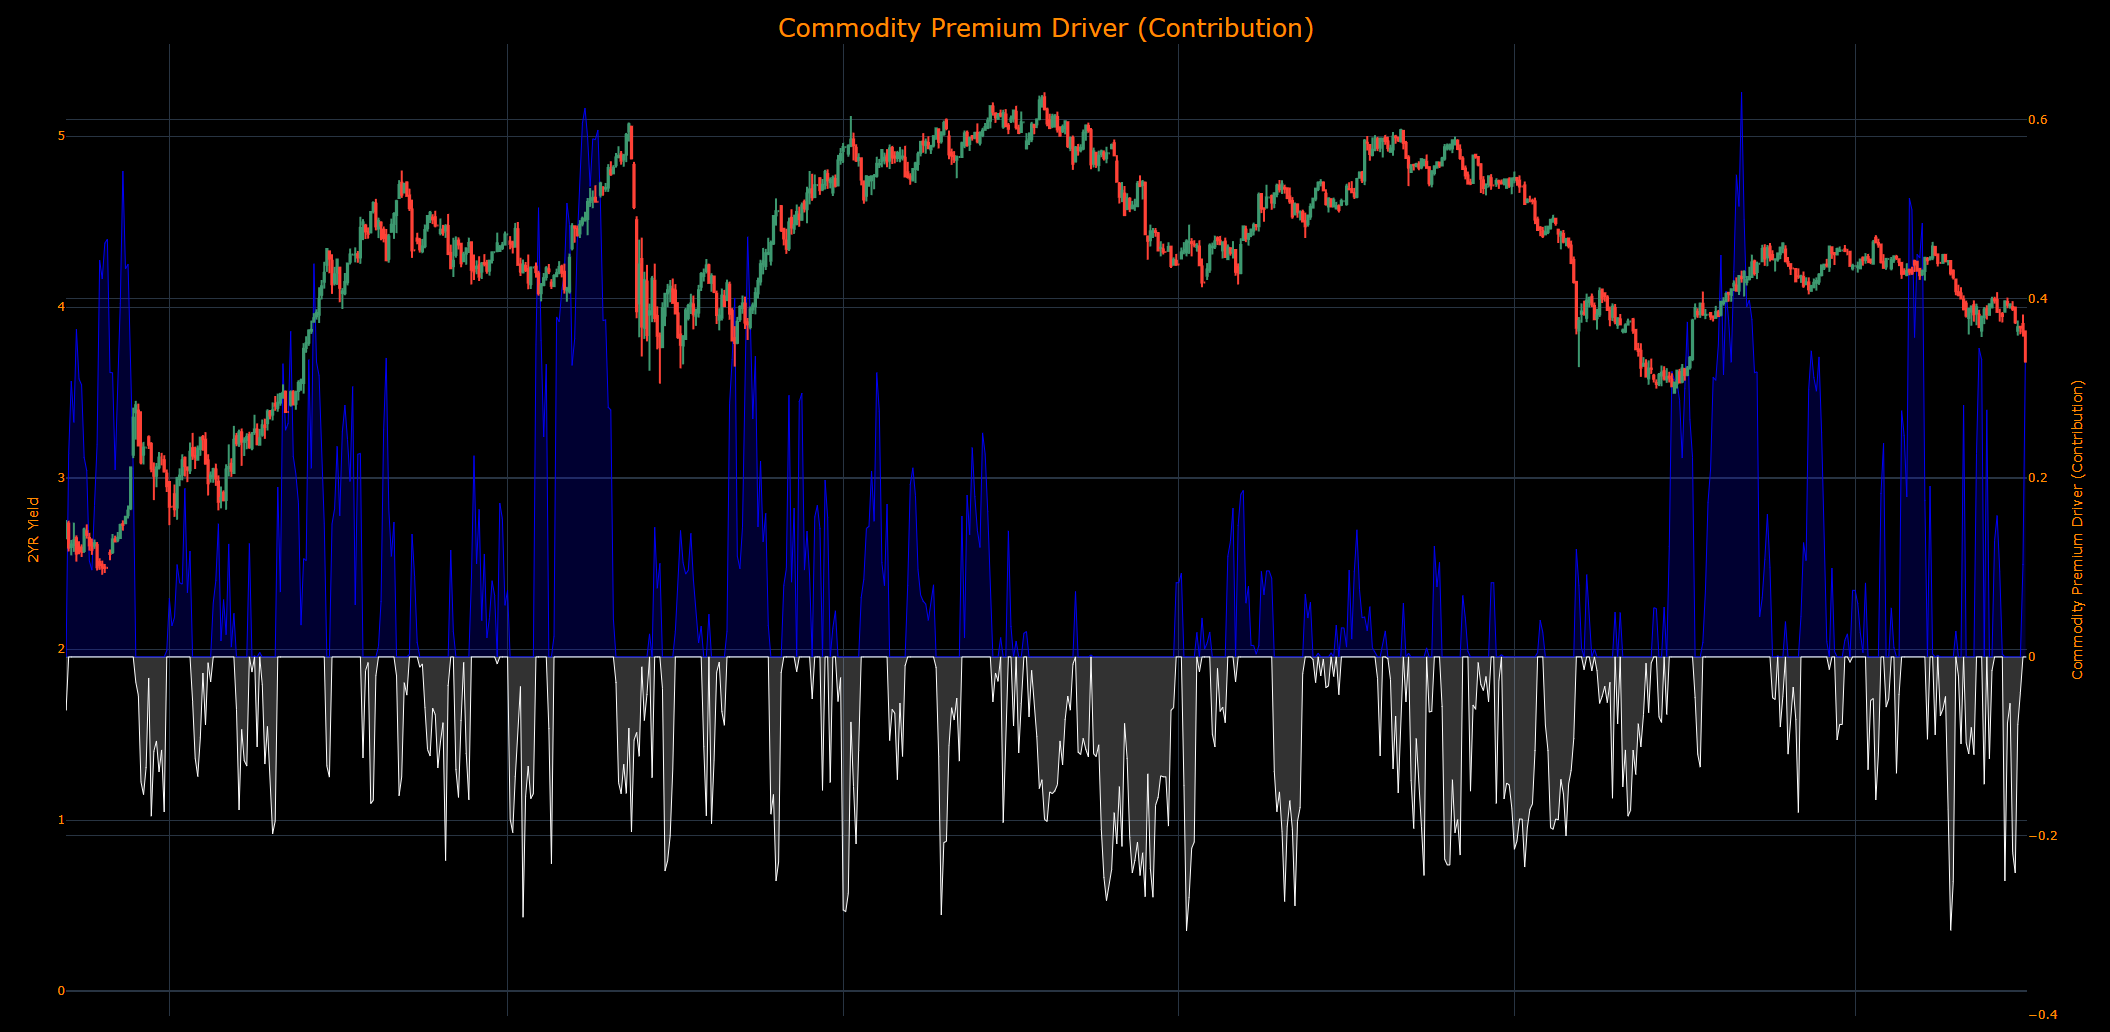
The Commodity Premium Driver contribution identifies HOW the drivers of commodities are contributing to 2-year returns. In the same manner, the higher the contribution moves, the more strength the drivers have in pushing rates in a specific direction.
The Growth Risk Premium Driver contribution identifies HOW the drivers of growth are contributing to 2-year returns. In the same manner, the higher the contribution moves, the more strength the drivers have in pushing rates in a specific direction.

Gold
==================================================
Technical Levels for GC1 Comdty (Date: 2025-04-04)
==================================================
Daily Range: 27.70
Resistance Levels (Above Open):
------------------------------
R5: 3212.42 | Offset: +101.92
R4: 3154.13 | Offset: + 43.63
R3: 3124.17 | Offset: + 13.67 *
R2: 3117.33 | Offset: + 6.83 *
R1: 3115.59 | Offset: + 5.09 *
------------------------------
Open Price: 3110.50
------------------------------
Support Levels (Below Open):
------------------------------
S1: 3103.67 | Offset: - 6.83 *
S2: 3099.00 | Offset: - 11.50 *
S3: 3083.17 | Offset: - 27.33 *
S4: 3081.10 | Offset: - 29.40
S5: 3078.01 | Offset: - 32.49
==================================================
* Denotes intraday level, likely tested
In the top panel, the total impulse of macro drivers and positioning is illustrated in its strength. The greater the strength in the move, the higher the probability and amplitude of the move that is likely to take place. The bottom panel illustrates if the skew is either bullish or bearish probability.
Gold is fundamentally about macro liquidity which means the drivers are marginally different than ES and the 2-year.

The US Macro Liquidity Driver contribution identifies HOW the drivers of US liquidity are contributing to the returns of Gold. In the same manner, the higher the contribution moves, the more strength the drivers have in pushing gold in a specific direction.

The Gold Risk Premium Driver contribution identifies HOW the risk premium of gold is contributing to returns. In the same manner, the higher the contribution moves, the more strength the drivers have in pushing gold in a specific direction.

The Dollar Liquidity Driver contribution identifies HOW the drivers of dollar liquidity are contributing to the returns of Gold. In the same manner, the higher the contribution moves, the more strength the drivers have in pushing gold in a specific direction.

The Global Liquidity Driver contribution identifies HOW the drivers of global liquidity are contributing to the returns of Gold. In the same manner, the higher the contribution moves, the more strength the drivers have in pushing gold in a specific direction.

Bitcoin
==================================================
Technical Levels for XBTUSD Curncy (Date: 2025-04-04)
==================================================
Daily Range: 1232.45
Resistance Levels (Above Open):
------------------------------
R5: 84185.05 | Offset: +1869.20
R4: 83958.45 | Offset: +1642.60
R3: 83925.49 | Offset: +1609.64
R2: 83503.36 | Offset: +1187.51 *
R1: 83385.46 | Offset: +1069.61 *
------------------------------
Open Price: 82315.85
------------------------------
Support Levels (Below Open):
------------------------------
S1: 82301.64 | Offset: - 14.21 *
S2: 81757.85 | Offset: -558.00 *
S3: 81217.82 | Offset: -1098.03 *
S4: 79422.42 | Offset: -2893.43
S5: 78113.75 | Offset: -4202.10
==================================================
* Denotes intraday level, likely tested
In the top panel, the total impulse of macro drivers and positioning is illustrated in its strength. The greater the strength in the move, the higher the probability and amplitude of the move that is likely to take place. The bottom panel illustrates if the skew is either bullish or bearish probability.

The US Macro Liquidity Driver contribution identifies HOW the drivers of US liquidity are contributing to the returns of Bitcoin. In the same manner, the higher the contribution moves, the more strength the drivers have in pushing Bitcoin in a specific direction.

The Bitcoin Risk Premium Driver contribution identifies HOW the risk premium of Bitcoin is contributing to returns. In the same manner, the higher the contribution moves, the more strength the drivers have in pushing the Bitcoin in a specific direction.

The Dollar Liquidity Driver contribution identifies HOW the drivers of dollar liquidity are contributing to the returns of Bitcoin. In the same manner, the higher the contribution moves, the more strength the drivers have in pushing Bitcoin in a specific direction.

The Global Liquidity Driver contribution identifies HOW the drivers of global liquidity are contributing to the returns of Bitcoin. In the same manner, the higher the contribution moves, the more strength the drivers have in pushing Bitcoin in a specific direction.

Final Note:
We are seeing a marginal shift in the 2-year strategy with the skew turning bullish. This has overlapped with Bitcoin turning marginally bullish as well. As more and more cuts get priced into the forward as equities sell off, this creates an overlap in positioning where if the cuts aren’t realized then it will likely cause bonds to pull back and equities to rally.
The equity risk premium driver is critical to watch here given the LEVEL of valuations.
If you are trying to understand these drivers, I suggest you go through all the Macro Alpha Primers:
Macro Alpha Primers:
Macro Alpha Primer: Credit Risk and Duration Risk and Macro Podcast: Macro Alpha Primer
Macro Alpha Primer: Correlations and Macro Podcast: Macro Alpha Primer
Macro Alpha Primer: Macro Catalysts, Hedging Pressure, and Positioning and Macro Podcast: Macro Alpha Primer
Macro Alpha Primer: Positioning Premiums and Macro Podcast: Macro Alpha Primer
As always, a Pepe for the culture:

The information on this website/Substack is for information purposes only. It is believed to be reliable, but Capital Flows does not warrant its completeness or accuracy. The information on the website/Substack is not intended as an offer or solicitation for the purchase of stock or any financial instrument. The information and materials contained in these pages and the terms, conditions and descriptions that appear, are subject to change without notice. Unauthorized use of Capital Flows websites and systems including but not limited to data scraping, unauthorized entry into Capital Flows systems, misuse of passwords, or misuse of any information posted on a site is strictly prohibited. Your eligibility for particular services is subject to final determination by Capital Flows and/or its affiliates. Investment services are not bank deposits or insured by the FDIC or other entity and are subject to investment risks, including possible loss of principal amount invested. Your use of any information which is proprietary to Capital Flows or a third-party information provider shall only be used on individual devices without any right to redistribute, upload, export, copy, or otherwise transfer the information to any centralized interdepartmental or shared device, directory, database or other repository nor to otherwise make it available to any other entity/person/third party, without the prior written consent of Capital Flows.