

The Research HUB: FX Primer, Pt 3
The primer for understanding and trading FX

Hey everyone,
This is Part 3 of the FX primer. Here is the initial breakdown of the 5 part series:
5-Part FX Primer Breakdown:
Part 1: FX - Resources, The Big Picture, Variables, Aggregating Knowledge, and Essential Tools.
Part 2: FX - Synthesizing Information from Part 1: Theory, Practice, Causal Mechanics vs. Regression Analysis.
Part 3: Delving into Historical Case Studies: The Importance of Studying History, Continuity vs. Discontinuity, and the Challenges of Backtesting in FX.
Part 4: Examining the Current Environment.
Part 5: Integrating Knowledge: Top-Down and Bottom-Up Analysis, Attribution Analysis, the Expectations vs. Actual Matrix, and Quantitative Models.
Be sure to read Part 1 here:
The Research HUB: FX Primer, Pt 1

Hey everyone, This article will serve as Part 1 of a 5-part series, acting as an FX primer. For those interested, I've previously written primers on both the S&P500 (link) and the bond market (link). If you have spent any time at all in FX markets, you know that sometimes a move makes total sense, and then the next move makes zero sense. On top of that, FX isn’t like equities where it just always (theoretically ;) ) goes up and to the right!
And Part 2 here:
The Research HUB: FX Primer, Pt 2

Hey everyone, This is part 2 of the FX primer. Here is the initial breakdown of the 5 part series: 5-Part FX Primer Breakdown: Part 1: FX - Resources, The Big Picture, Variables, Aggregating Knowledge, and Essential Tools. Part 2: FX - Synthesizing Information from Part 1: Theory, Practice, Causal Mechanics vs. Regression Analysis.
We have broken down HOW to quantify the moving parts pertaining to FX. In this section, we will go through some case studies, and I will provide the principles that I personally use when conducting backtests and historical studies. I will also provide a list of resources that I use.
An initial example is the article I wrote on Argentina:
The Research HUB: Lessons From Argentina

In this article, I will be sharing lessons from the crisis in Argentina that took place in the late '90s and early 2000s. I will explain how to think about markets in the context of this crisis, connect it with recent examples, and then provide a framework for maneuvering future crises.
Let’s get into it!
Intro:
We have covered many of the ideas for quantifying the moving parts pertaining to FX, but this only gets you so far. In the second article, I noted that you need to understand the GIP of a country, the balance of payments, and the impossible trinity. The difficulty that arises is that even with these three ideas, there can be many different combinations of them that move FX. Most of the time, you need to spend time reading history to ensure you are quantifying data points correctly.
On top of all of this, history is clear (theoretically) in retrospect. When you are operating under uncertainty in the present, you are in a constant state of analyzing the distribution of probabilities as they might occur.
When you look back on history, it's easy to fall into a deterministic mindset instead of a probabilistic one. This will be a key point to keep in mind because when you study history, you need to intentionally think about how probabilities and potential scenarios develop, as opposed to merging all data/ideas to the actual outcome that occurred.

The Importance of Studying History:
There are several principles I keep in mind when studying history, whether it's for FX or any other purpose.
There is no substitute for real experience, but one way you can offset a lack of experience is by studying history. Regardless of the amount of time you have been in markets, there will always be experiences you haven’t encountered. History can serve as a tool to navigate this.
Studying history frames the significance of data. It is very interesting to me that some quants will spend all day with various datasets and literally not know what was causing the data to change during a specific period of time. I always want to know the WHY behind data during specific periods because this informs HOW I will categorize and quantify that period.
The final point I will make is that studying history is one of the best tools for redundancy planning, scenario analysis, and analyzing the present.
To be resilient you have to think preemptively
I wrote an entire article on this idea:
Information Age, Thinking Preemptively and Market Update

I would like to take a quick moment and welcome all the new subscribers. We are going to cover a lot together! Always feel free to DM me on Twitter or email me. I have a lot going on right now but I enjoy interacting and helping people. In this publication, I am going to share several big-picture ideas and then we will get into some market views with sc…
Continuity vs. Discontinuity:
On a more technical note, any time I am backtesting or thinking about history, I always consider continuity and discontinuity in scenarios. Many times, phrases such as “this time is different” or “this time is not different” are more about clickbait and reductionism than actual analysis.
There are ALWAYS differences, and there are ALWAYS similarities. It's more about identifying causal factors that are similar to the past so that you can act in a statistically significant manner. Then, you account for discontinuities so that you correctly employ a priori thinking where it is needed.
The Challenges of Backtesting in FX:
There are several challenges you will run into when backtesting FX:
Idiosyncratic events relating to the impossible trinity are not very clear when you are only looking at the data. For example, when the BoJ intervened in currency markets in 2022, it would be very difficult for someone to know that only by studying price action and data 20 years from now. Obviously, this intervention was incredibly important for the Yen. The same would be true for studying FX moves 20 years ago, except even more difficult because they didn't have as much financial media coverage as today.
This brings me to my second point: historically, we have much better data, financialization, liquidity, and transparency than in the past. For example, we didn't always have incredibly liquid future contracts pricing FX or interest rates into the future. On top of all of this, economic data can be manipulated. We are obviously seeing this with China right now, and they are not the first to do this. However, just because a country is manipulating their economic data, doesn't disconfirm the idea that their balance of payments needs to balance and that all money that is anywhere comes from somewhere.
Final point: identify what you can quantify with data and then go to source documents FIRST for things that are difficult to quantify or highly idiosyncratic. Source research is one of the most important things you can do. Just look at all the different views on inflation we have today. Whoever ends up writing a book on it is just going to embed their bias from whatever camp they are in. Source research is the name of the game. Source research is one of the main things that has helped me the most over the years.
Delving into Historical Case Studies:
There are two ways I think about studying FX: 1) Study the full history of the currency you plan on trading and 2) study all the major FX events that have taken place.
We could go back even farther but here is a list of the major FX events that have occurred over the past couple hundred years. (if you want a great historical book on money, check out The Price Of Time! Really amazing book!)
The Mississippi Bubble (1719-1720): In France, John Law's Mississippi Company, which had taken over the national debt and had the right to issue paper money, saw its shares and the value of banknotes collapse, leading to a loss of confidence in the currency.
The South Sea Bubble (1720): In Britain, the South Sea Company's collapse led to a financial crisis. While it's primarily a stock market event, it had implications for the broader British financial system.
Latin American Independence (19th Century): Many newly independent Latin American nations defaulted on their debts in the 19th century, leading to FX volatility.
German Hyperinflation (1921-1923): Following World War I and the Treaty of Versailles, Germany experienced hyperinflation, with the mark becoming virtually worthless. At its peak, billions of marks were needed to buy a single U.S. dollar.
British Pound Sterling Abandonment of Gold (1931): During the Great Depression, Britain left the gold standard, leading to a devaluation of the pound.
U.S. Dollar Devaluation (1933-1934): As part of the New Deal response to the Great Depression, the U.S. left the gold standard and devalued the dollar by raising the official price of gold.
French and Belgian Devaluation (1936): Both countries left the gold standard and devalued their currencies in response to the economic pressures of the 1930s.
Several Devaluations during the Late 1940s: After World War II and before the full establishment of the Bretton Woods system, several countries, including the UK and France, devalued their currencies against the U.S. dollar.
Bretton Woods System Collapse (1971): The U.S. abandoned the gold standard, leading to the end of the Bretton Woods system and the beginning of freely floating exchange rates.
Black Wednesday (1992): The British pound was forced out of the European Exchange Rate Mechanism (ERM) after the Bank of England failed to keep it above its agreed lower limit.
Mexican Peso Crisis (1994-1995): A sudden devaluation of the Mexican peso led to financial turmoil, requiring a massive bailout from the U.S. and the IMF.
Asian Financial Crisis (1997-1998): Began in Thailand with the collapse of the Thai baht, spreading to other Asian economies, leading to sharp declines in currencies and stock markets.
Russian Financial Crisis (1998): Russia defaulted on its debt and devalued the ruble, leading to widespread panic in global financial markets.
Brazilian Currency Crisis (1999): Brazil devalued its currency, the real, leading to significant economic turmoil.
Argentine Economic Crisis (2001-2002): Argentina defaulted on its debt and abandoned the peg of its currency, the peso, to the U.S. dollar, leading to a sharp devaluation.
Icelandic Financial Crisis (2008): The collapse of Iceland's banking system led to a sharp depreciation of the Icelandic króna and a severe economic downturn.
Swiss Franc Shock (2015): The Swiss National Bank unexpectedly abandoned its cap on the Swiss franc's value against the euro, leading to a rapid appreciation of the franc.
Turkish Lira Crisis (2018): Political tensions, concerns about monetary policy, and economic vulnerabilities led to a sharp depreciation of the Turkish lira.
COVID-19 Pandemic (2020): The global spread of the coronavirus led to significant volatility in the FX markets, with the U.S. dollar initially strengthening due to its safe-haven status and then weakening as central banks around the world implemented unprecedented monetary easing measures.
Resources:
To wrap things up, I will share the resources I use for conducting this type of research. The best starting point is finding books and academic papers, but there are many other great tools.
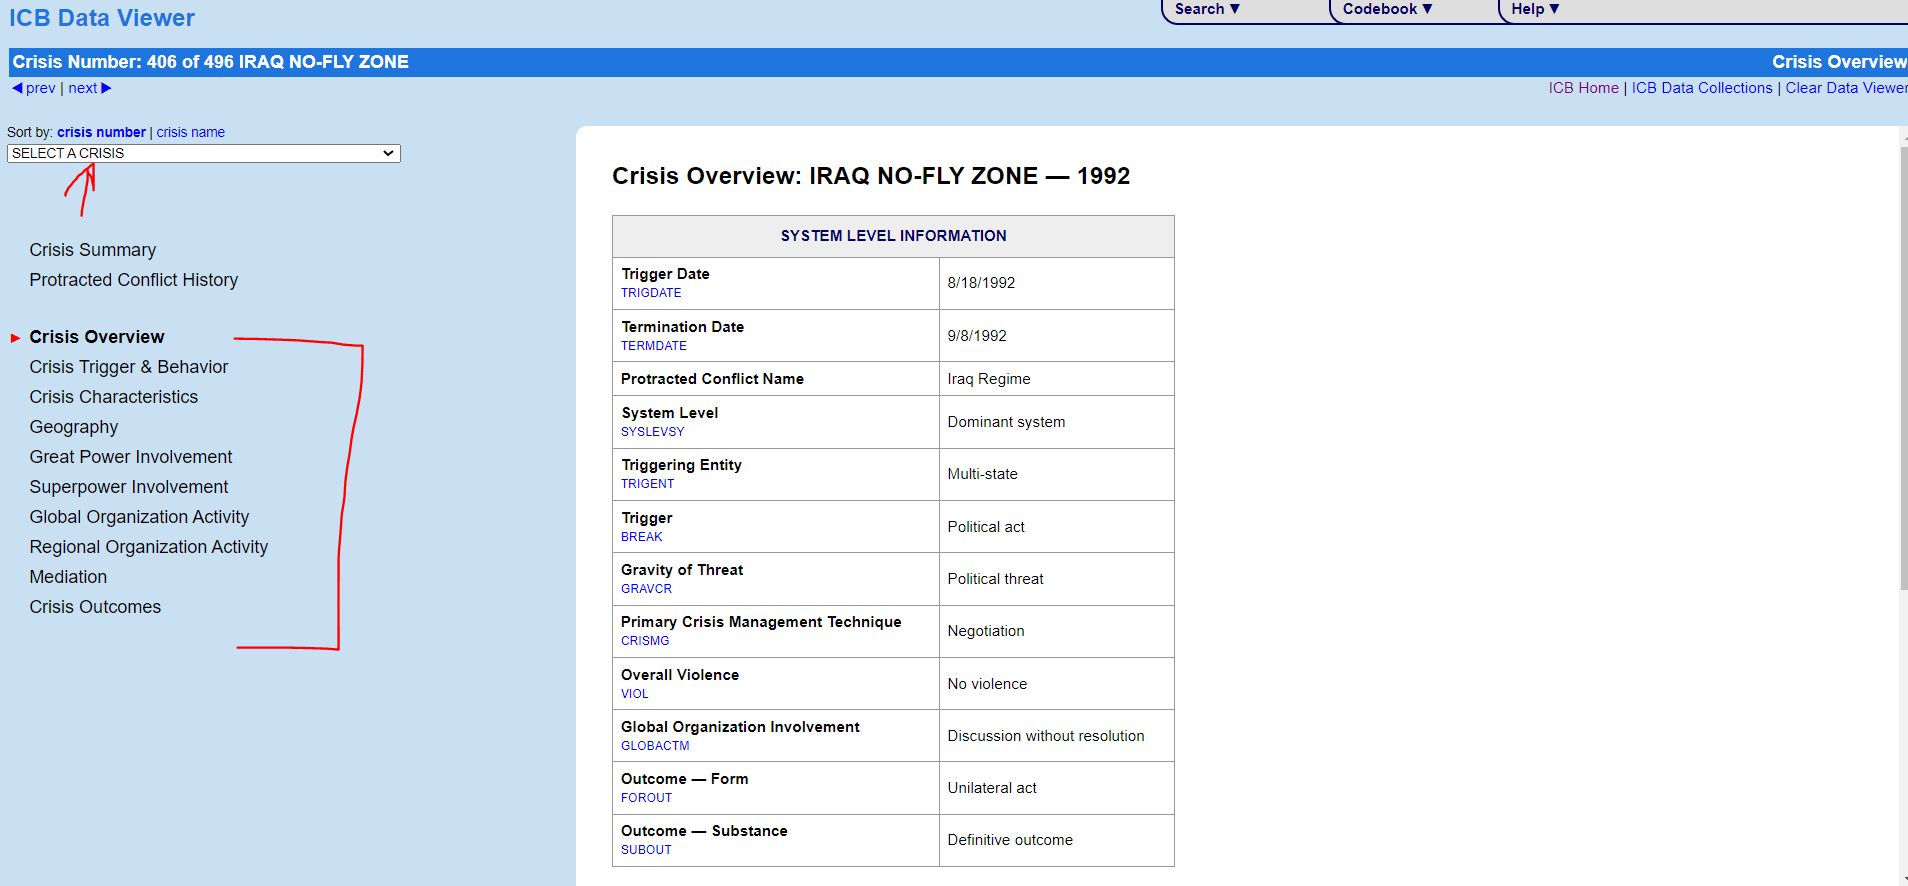
International Crisis Behavior Project:
Link: http://www.icb.umd.edu/dataviewer/
This is a great tool that breaks down many of the major crises since 1900.
You can select the crisis you want to view and then go through very detailed tabs that provide a multidimensional picture of the crisis. This is a tool I use frequently.
Finally, in no specific order or significance, here is a list of resources I have aggregated:
https://carnegieendowment.org/publications/interactive/indian-ocean-map
https://carnegieendowment.org/
https://carnegieendowment.org/publications/interactive/protest-tracker
https://carnegieendowment.org/publications/interactive/aI-surveillance
https://carnegieendowment.org/regions
https://carnegieendowment.org/publications/interactive/russia-oil-map/
https://www.cfr.org/global-conflict-tracker#!/global-conflict-tracker
https://earth.nullschool.net/#current/wind/isobaric/1000hPa/orthographic
https://internationalaffairsresources.com/
https://www.americanprogress.org/article/interactive-map-foreign-aid/
https://globalpartnerships.uconn.edu/partnership-map/#
https://diplomacy.state.gov/discover-diplomacy/diplomacy-explorer-map/
https://www.marineregions.org/
https://www.understandingwar.org/
A lot of these resources have a geopolitical bent but think about it: major changes in a country's balance sheet and income statement usually occur when large geopolitical events happen.
Conclusion:
Alright! We have finished part 3!
The next two articles of the FX primer will be WAY MORE tangible and will really synthesize all of these moving parts as they connect with the current environment.
The true value is in synthesizing all of these moving parts in real-time, identifying how risk premiums are being reflected across all markets as they connect with the current GIP setup, and then executing trades with proper risk management.
A principle I live by: There is no excitement without uncertainty.
You have to take risks to push yourself and test your ideas. That is where all the challenge and excitement lie.
In the information age, you simply need to be at the right place, at the right time, with the right information to succeed
Thanks for reading!