

The Research HUB: Intraday Trading Primer
How To Run Intraday Trades and Build Intraday Models

Hey everyone,
This article is going to be an educational primer on intraday trading. You will notice that I have written primers on the S&P500 (link), bonds (link), and FX (link), BEFORE this one. This is intentional because understanding the big picture is a prerequisite.
Intraday trading is the most difficult timeframe to operate on unless you have a very very clear advantage. The problem is that intraday trading is marketed to the retail community as THE way to make money. On top of this, intraday trading is almost always framed incorrectly because people typically focus on some type of rule or setup instead of understanding HOW liquidity provision works on an intraday timeframe.
What do I mean by this? Well think about it like this, I might have some type of rule that is great at executing trades and extracting returns. However, if I only know that rule and not HOW the system works or WHY that rule works, then eventually I will lose my edge. The market doesn’t operate according to the rules you might employ for execution and trading. Those rules are the process by which you maneuver the uncertainty of markets, NOT how they operate.
For example, you might have a moving average crossover or a specific % pullback that you use as a signal for taking action. While this might work in a backtest and maybe even on a forward-looking basis, the rule doesn’t dictate what the market is supposed to do.
This is where Soros basically got his fame. His whole idea was not finding rules to make money but identifying when the rules changed.

Let me share a tangible example of an intraday edge that eventually faded. Earlier this year, we saw 0dte option flow have a significant impact on intraday price action, especially if we had a large deviation before lunchtime that went to an open interest level. Basically, if there was a large deviation on the upside or downside to a large open interest level where a lot of 0dte volume was taking place, I would basically fade the move. Eventually, this type of characteristic disappeared and the strategy began to lose money.
If your ability is connected to a single scenario or rule, it will eventually fade. This is why you need to have a correct understanding of the liquidity provision mechanics in the market so that you can adapt to the market correctly.
In the first article, I explained this process (link):

Also, refer to the article on risk on risk off regimes for further elaboration on this:
The Research Hub: Risk On / Risk Off Regimes

Hey everyone, There is a lot of discussion out there as to if we are still in a bear market or have entered a new bull market. What complicates things further is everyone seems to have a different definition of a bull or bear market that they assert is “the correct definition”, as if something could even be possible.
In this article, we are going to break down the following:
Intraday Liquidity Provision Theory
Players and Timeframes
Pure Price Actions and Information Tension
Building Blocks For Quantifying Intraday Price Action
Options Flow
Intro:
Instead of starting with, “Look for x type of pattern to get long or short,” we want to start by examining the underlying mechanics of the market and its microstructure that both cause patterns and change them.
Knowing the WHY behind specific price action characteristics, allows you to build views/strategies that have durability. Blindly following “statistical facts” is a sure way to get into trouble when the rules of the game change. It goes back to that famous poker quote:
Look Around the Poker Table; If You Can’t See the Sucker, You’re It

Intraday Liquidity Provision Theory:
We are going to start partially on a theoretical note and go over some principles of liquidity:
Why does the price even move?
Fundamentally, the price of any asset moves because there ISN’T liquidity for the bid or the ask. For example, if the S&P500 is moving up, it is because there are more buyers than sellers. However, it is that the buyers need to move the price higher in order to get filled by more sellers.
When I think about price, it moves because there isn’t enough liquidity to satisfy the buyers or sellers. Theoretically, market participants don’t need to move the price to get their orders filled IF a player on the opposite side comes in with a comparable-sized order.
You might have seen this before in markets where the price is pinned at a specific level and a large number of transactions get run through as volume spikes. Basically, two or more players find an agreed-upon price and enough size to transact against so that the price doesn’t need to move dramatically (obviously this doesn’t last for long).
This type of dynamic is the opposite of a situation where a player must move the price to obtain liquidity (from this book):

Big picture, when I think about buyers and sellers, both need to either transact against the opposite in comparable size OR move the price until they get their fill. A lot of the intraday moves we see function as the liquidity provision mechanism for this.
Liquidity and Time:
The limitation of this theory is that execution and liquidity in the market don’t function in a linear and smooth fashion. This is part of the reason noise exists in markets. Liquidity is never evenly distributed through time.
This makes intuitive sense. Sometimes you might see a very smooth intraday trend in the price of an asset only to be slammed down by a huge sell order.
Understanding these ideas of price, volume, liquidity and time will be key when we begin to quantify the periods of time for optimal execution during the day.
Shadow On The Wall:
The final part of theory I want to touch on is that the price action and volume we see are only a reflection of the true underlying supply and demand components. While all of our P&L is ultimately denominated in the price, there is a lot more going on under the surface that is unseen.
More Resources:
If you want to spend more time understanding the microstructure and mechanics of the market in this shorter-term timeframe, check out the following resources:
Trades, Quotes and Prices Book. Amazing book!
The following papers:
https://papers.ssrn.com/sol3/papers.cfm?abstract_id=2668277
https://papers.ssrn.com/sol3/papers.cfm?abstract_id=488422
https://papers.ssrn.com/sol3/papers.cfm?abstract_id=1712822
https://papers.ssrn.com/sol3/papers.cfm?abstract_id=2549739
https://papers.ssrn.com/sol3/papers.cfm?abstract_id=2878945
https://papers.ssrn.com/sol3/papers.cfm?abstract_id=569982
https://papers.ssrn.com/sol3/papers.cfm?abstract_id=1913982
https://papers.ssrn.com/sol3/papers.cfm?abstract_id=4259584
https://papers.ssrn.com/sol3/papers.cfm?abstract_id=3900141
https://papers.ssrn.com/sol3/papers.cfm?abstract_id=2852760
https://papers.ssrn.com/sol3/papers.cfm?abstract_id=3305277
https://papers.ssrn.com/sol3/papers.cfm?abstract_id=3687746
https://papers.ssrn.com/sol3/papers.cfm?abstract_id=1127744
https://papers.ssrn.com/sol3/papers.cfm?abstract_id=3551166
https://papers.ssrn.com/sol3/papers.cfm?abstract_id=675665
https://papers.ssrn.com/sol3/papers.cfm?abstract_id=741365
https://papers.ssrn.com/sol3/papers.cfm?abstract_id=3479741
https://papers.ssrn.com/sol3/papers.cfm?abstract_id=965674
https://papers.ssrn.com/sol3/papers.cfm?abstract_id=3497001
https://papers.ssrn.com/sol3/papers.cfm?abstract_id=241728
https://papers.ssrn.com/sol3/papers.cfm?abstract_id=988886
https://papers.ssrn.com/sol3/papers.cfm?abstract_id=1342228
https://papers.ssrn.com/sol3/papers.cfm?abstract_id=1787625
https://papers.ssrn.com/sol3/papers.cfm?abstract_id=1373762
https://papers.ssrn.com/sol3/papers.cfm?abstract_id=3714230
https://papers.ssrn.com/sol3/papers.cfm?abstract_id=229959
https://papers.ssrn.com/sol3/papers.cfm?abstract_id=2996221
https://papers.ssrn.com/sol3/papers.cfm?abstract_id=4320775
https://www.smallake.kr/wp-content/uploads/2015/11/SSRN-id2668277.pdf
https://ericbudish.org/wp-content/uploads/2022/06/Flow-Trading-June-23-2022.pdf
https://www.researchgate.net/publication/314510860_Effects_of_the_Limit_Order_Book_on_Price_Dynamics
https://www.readcube.com/articles/10.2139%2Fssrn.1914293
https://docs.lib.purdue.edu/cgi/viewcontent.cgi?article=3209&context=open_access_dissertations
https://hal.science/hal-00397652v3/document
https://epubs.siam.org/doi/10.1137/130911196
https://hughchristensen.com/papers/academic_papers/SSRN-id1499209.pdf
https://www.hindawi.com/journals/sp/2021/9949565/
https://www.nber.org/system/files/working_papers/w25855/w25855.pdf
https://mpra.ub.uni-muenchen.de/101684/2/MPRA_paper_101684.pdf
http://tesi.luiss.it/27169/1/701851_PECCHIARI_MATTEO.pdf
https://edoc.hu-berlin.de/bitstream/handle/18452/4997/57.pdf?sequence=1
https://hughchristensen.com/papers/academic_papers/SSRN-id1433488.pdf
https://www.sciencegate.app/document/10.2139/ssrn.2022650
https://www.tse-fr.eu/sites/default/files/medias/doc/wp/fit/10-147.pdf
https://www.unibocconi.eu/wps/wcm/connect/aff80f23-9082-4c33-8bba-5399f2c01efb/rindi.pdf?MOD=AJPERES
https://sciendo.com/article/10.2478/fiqf-2020-0004?tab=references
https://arxiv.org/pdf/1312.3349.pdf
https://davidpublisher.com/Public/uploads/Contribute/5b1a2dbbe1a79.pdf
https://papers.ssrn.com/sol3/papers.cfm?abstract_id=1108485
https://papers.ssrn.com/sol3/papers.cfm?abstract_id=1108485
https://papers.ssrn.com/sol3/papers.cfm?abstract_id=459000
https://papers.ssrn.com/sol3/papers.cfm?abstract_id=2238087
https://papers.ssrn.com/sol3/papers.cfm?abstract_id=956476
https://papers.ssrn.com/sol3/papers.cfm?abstract_id=1997092
https://papers.ssrn.com/sol3/papers.cfm?abstract_id=676564
https://onlinelibrary.wiley.com/doi/10.1111/agec.12642
https://www.researchgate.net/publication/228469567_Optimal_display_of_iceberg_orders
https://link.springer.com/article/10.1007/s10436-017-0304-1
https://www.researchgate.net/publication/228261446_Optimal_Dipslay_of_Iceberg_Orders
https://openaccess.city.ac.uk/id/eprint/17333/14/10.1007%252Fs10436-017-0304-1.pdf
https://www.readcube.com/articles/10.2139%2Fssrn.3074049
http://fmwww.bc.edu/repec/esLATM04/up.23536.1081939804.pdf
https://www.econstor.eu/bitstream/10419/266836/1/1100.pdf
If you want to look into the specific types of limit order book dynamics that the resources above reference, look into Trading Technologies . They have some great resources on their website.
Players and Timeframes:
Being aware of the players and their respective timeframes is one of the most crucial evaluations you can perform when identifying if you even have an advantage intraday.
While there isn’t always a clear distinction between players, generally speaking, you have the HFT players, Stat Arb players, market makers, and then institutional players seeking liquidity for longer-term views/constraints.
If you have no clear informational edge, then you’re basically set up to lose if you compete against the HFT or Stat Arb guys. What does this mean practically? If you are trading on a 5-minute time horizon, it is HIGHLY unlikely you will consistently make money.
Let me provide an example. This is from Machine Learning for Asset Managers (Elements in Quantitative Finance)


Think about the types of models and strategies a firm is running in order to accomplish this type of trade. It is WAY MORE complex than using some moving averages and technical levels.
What Is The Implication?
The main idea here is that if you are trading on an intraday timeframe where you are trying to take advantage of moves on a 5-minute-15-minute chart, you’re against people who have a significant informational advantage and speed advantage against you.
It is not about “working harder” here. Unless you have access to the same degree of tools and speed, it will ultimately be like a kindergartener playing 1-on-1 against Shaquille O'Neal.

Now this is the question we finally come to. If you don’t have an advantage against these players, how in the world can you make money on a shorter timeframe? This is what the rest of the article lays out.
Pure Price Actions and Information Tension:
There are two major ways you can have an advantage on a shorter-term timeframe:
1) Have some type of sophisticated strategy based on an informational edge.
2) Have a different time preference and/or risk tolerance than the market.
1) Have some type of sophisticated strategy based on an informational edge.
A lot of players in the market are operating purely based on price action and correlations. If you have some type of informational edge that might not be contained in the price, this can be an advantage. For example, if you have a specific advantage in predicting how fundamental data or economic data is released relative to expectations, that can be an avenue.
An informational edge can also be individual stocks where you find an idiosyncratic positioning or flow dynamic that is unlikely to appear in a backtest. For example, a lot of L/S equity funds reveal their positioning as there are shocks to beta. An example was during COVID when funds went long AMZN / short M. As there were shocks to positioning, L/S funds had to unwind both sides of the trade.
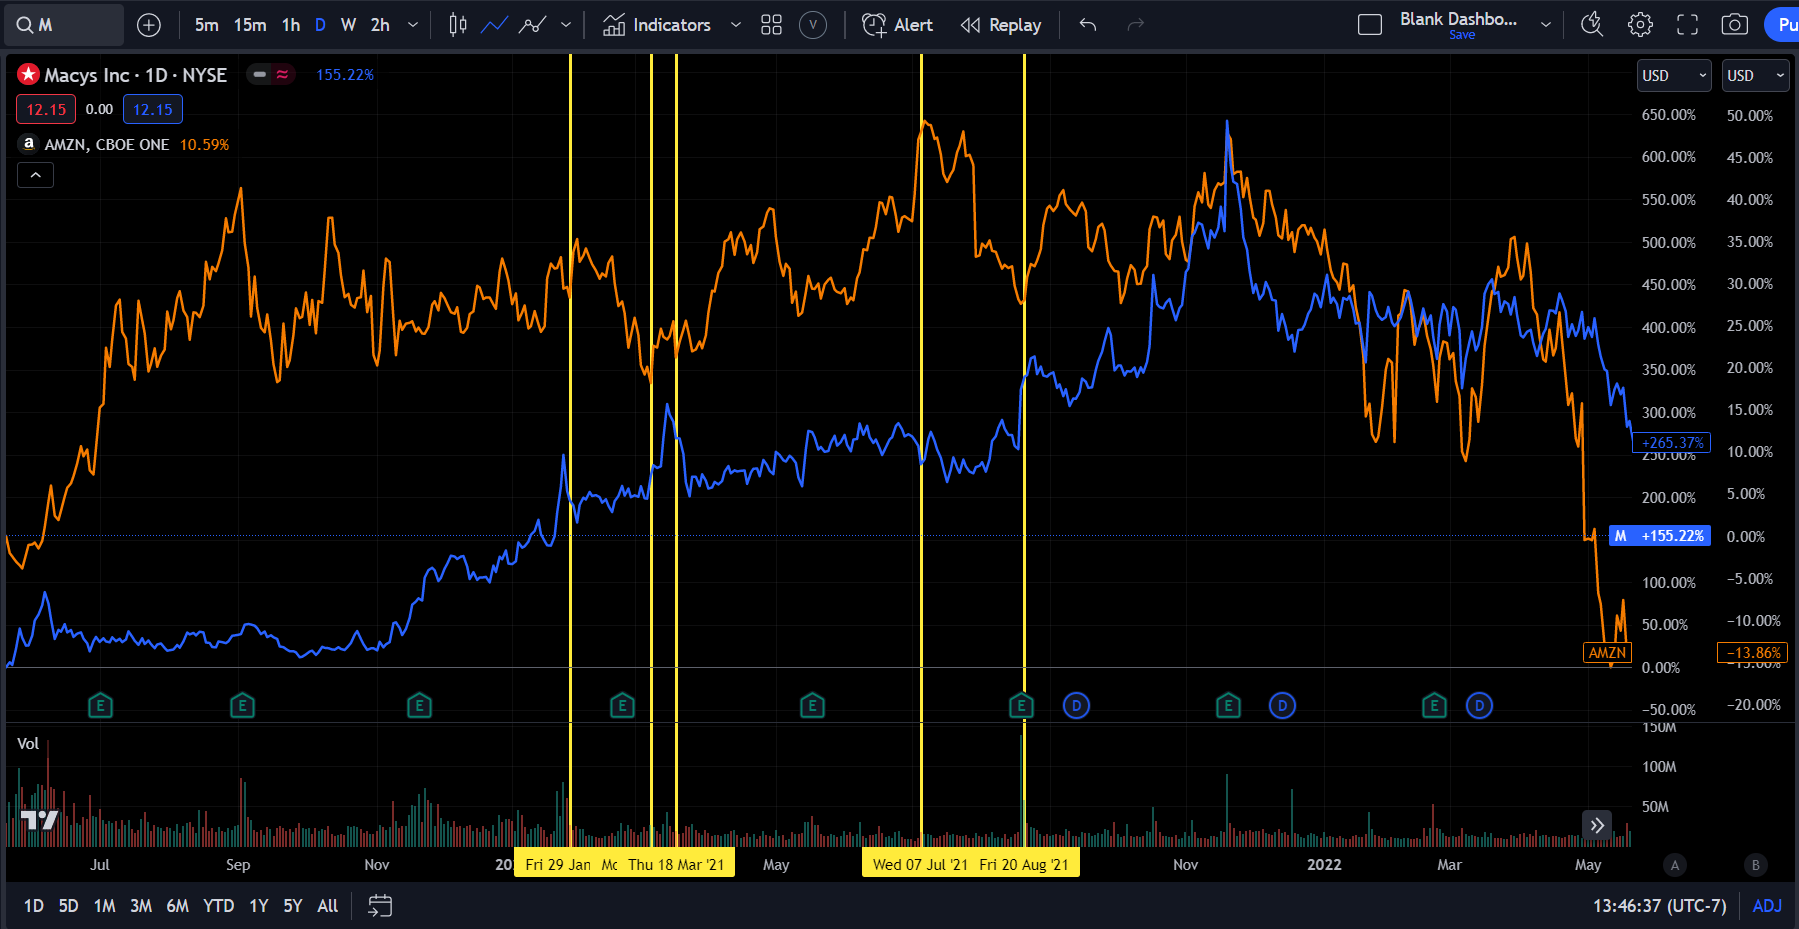
However, as you can see, this dynamic didn’t exist for a long time since L/S funds don’t account for all the buying and selling pressure in these individual stocks.
There are always small ways to try to identify these types of alphas but it is incredibly time-consuming since their persistence is usually short-lived. On top of that, you’ll usually have more success extracting these types of alphas by increasing your timeframe to a week.
If you want to focus on this type of alpha, you can spend time looking through the strategies in this paper and begin to connect it to specific situations today: https://papers.ssrn.com/sol3/papers.cfm?abstract_id=3247865
2) Have a different time preference and/or risk tolerance than the market.
This brings us to #2 which is the way I run intraday trades.
I don’t want to compete against the HFT and Stat Arb quants. They have their domain and they are really good at it. I want to have a higher timeframe than the players who execute all day every day.
What does this tangibly mean? It means the holding period is longer and frequency is lower. For example, if I have a specific mean reversion strategy that signals a trade, I am probably holding that position until the close or at the very least for 4-6 hours (sometimes longer). Additionally, since many people close out all their risks at the end of the day or at the end of the week, there are additional opportunities for people who take advantage of these effects.
Fundamentally, these types of intraday trades function as a liquidity-providing mechanism for players who NEED to execute in a specific period of time. For example, if a large player has to move the price in order to get his fill during a specific period of time, it is possible that the price will revert once he is finished.
Instead of thinking about intraday trades as specific rules and patterns, think about intraday trades as the price you charge for providing execution liquidity. If you understand HOW and WHY liquidity is functioning in the market, then you can begin to frame your rules and specific pattern identification around it.
This is what brings us to the quantification of these ideas.
Building Blocks For Quantifying Intraday Price Action:
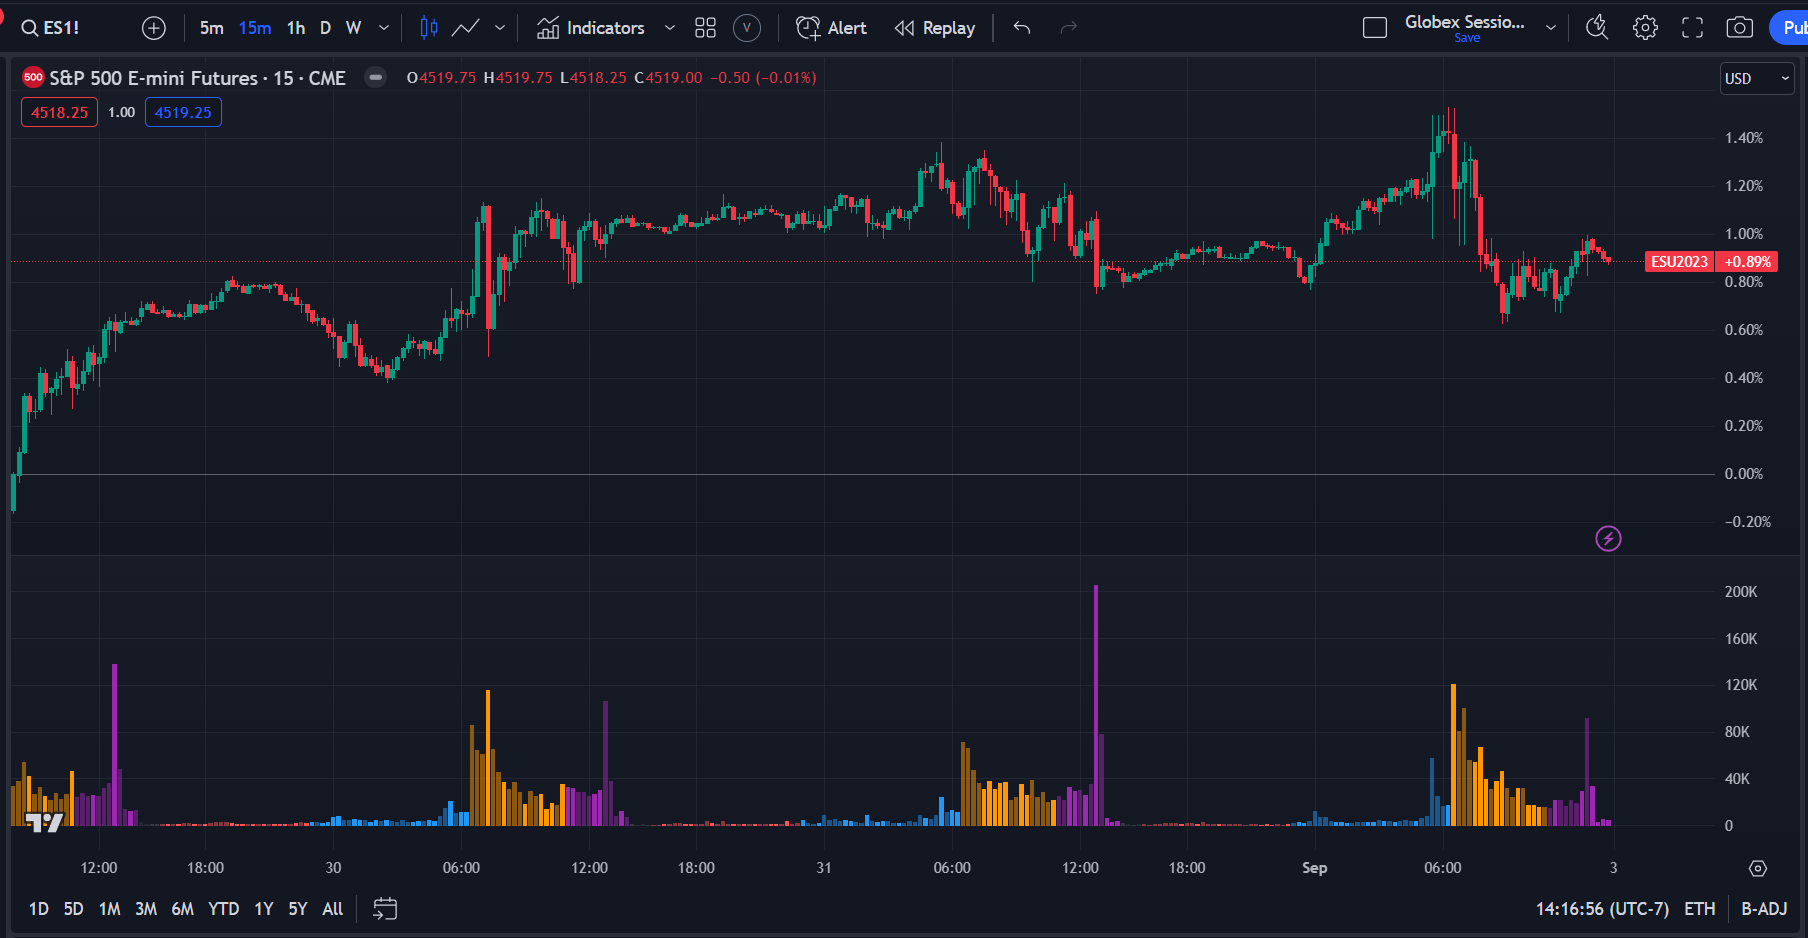
I am first going to go through the major data points/models you need and then we will synthesize them together. We will use ES in all the examples below but this can be adjusted for any asset.
Globex: You need to separate the session by all the periods of time it goes through and HOW price action moves through those periods of time.
When you think about an entire session, you want to break it up into the following pieces:
Overnight
First 30 mins
First half of the session
The second half of the session
Last 30 mins
This is primarily due to the regular volume profile that gets executed in ES. This could change depending on the asset and its trading hours (for example, gold and oil are different). The primary thing to consider here is WHEN most transactions are taking place.
Here are some great papers on it:
https://papers.ssrn.com/sol3/papers.cfm?abstract_id=3798844
https://papers.ssrn.com/sol3/papers.cfm?abstract_id=3760365
https://papers.ssrn.com/sol3/papers.cfm?abstract_id=4139328
https://papers.ssrn.com/sol3/papers.cfm?abstract_id=2852760
https://papers.ssrn.com/sol3/papers.cfm?abstract_id=2878945
Volume:
Volume is a helpful signal. Advances in Financial Machine Learning has a great section on dollar, volume, tick bars you can read. (To be honest with you, I still have some skepticism about volume signals but it is something I am still thinking about/researching.)
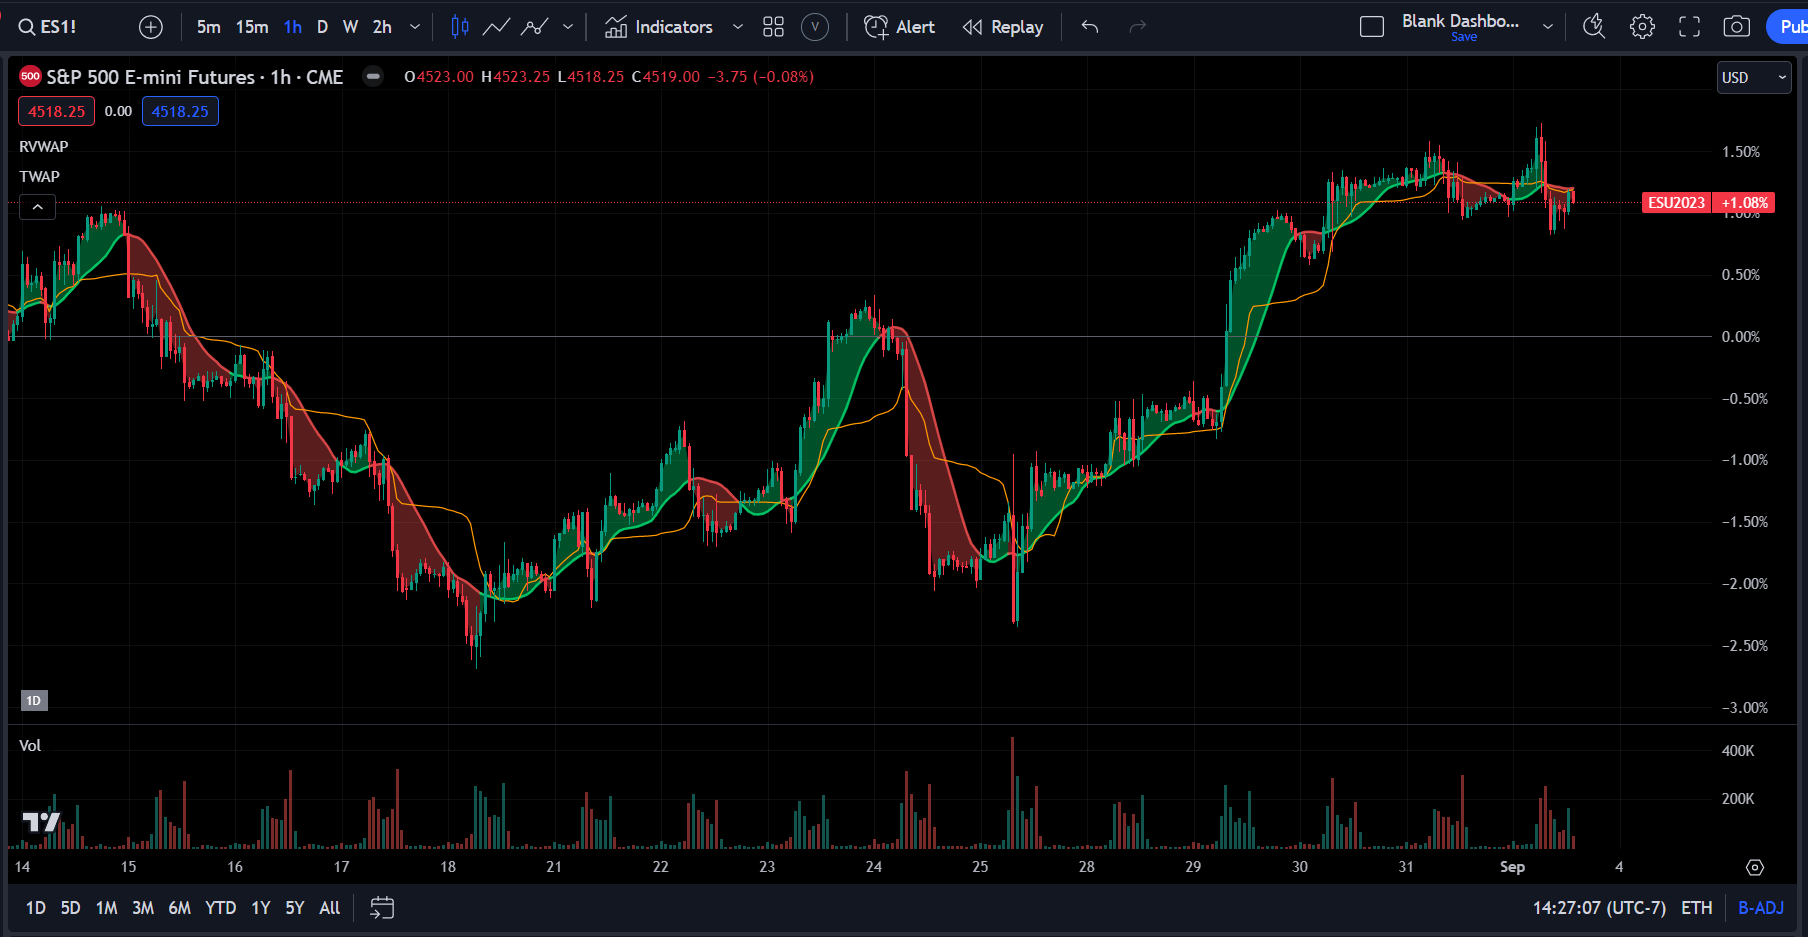
I would also look into the idea of “Order Imbalances” in the Trades, Quotes and Prices Book. You can look at TWAP deviation from VWAP for this idea. HOWEVER, don’t place a ton of significance on TWAP or VWAP as the way in which institutions execute trades. They don’t really do it based on VWAP anymore. This doesn’t mean they can’t provide value if you are connecting it with the Globex session and OHLC levels.
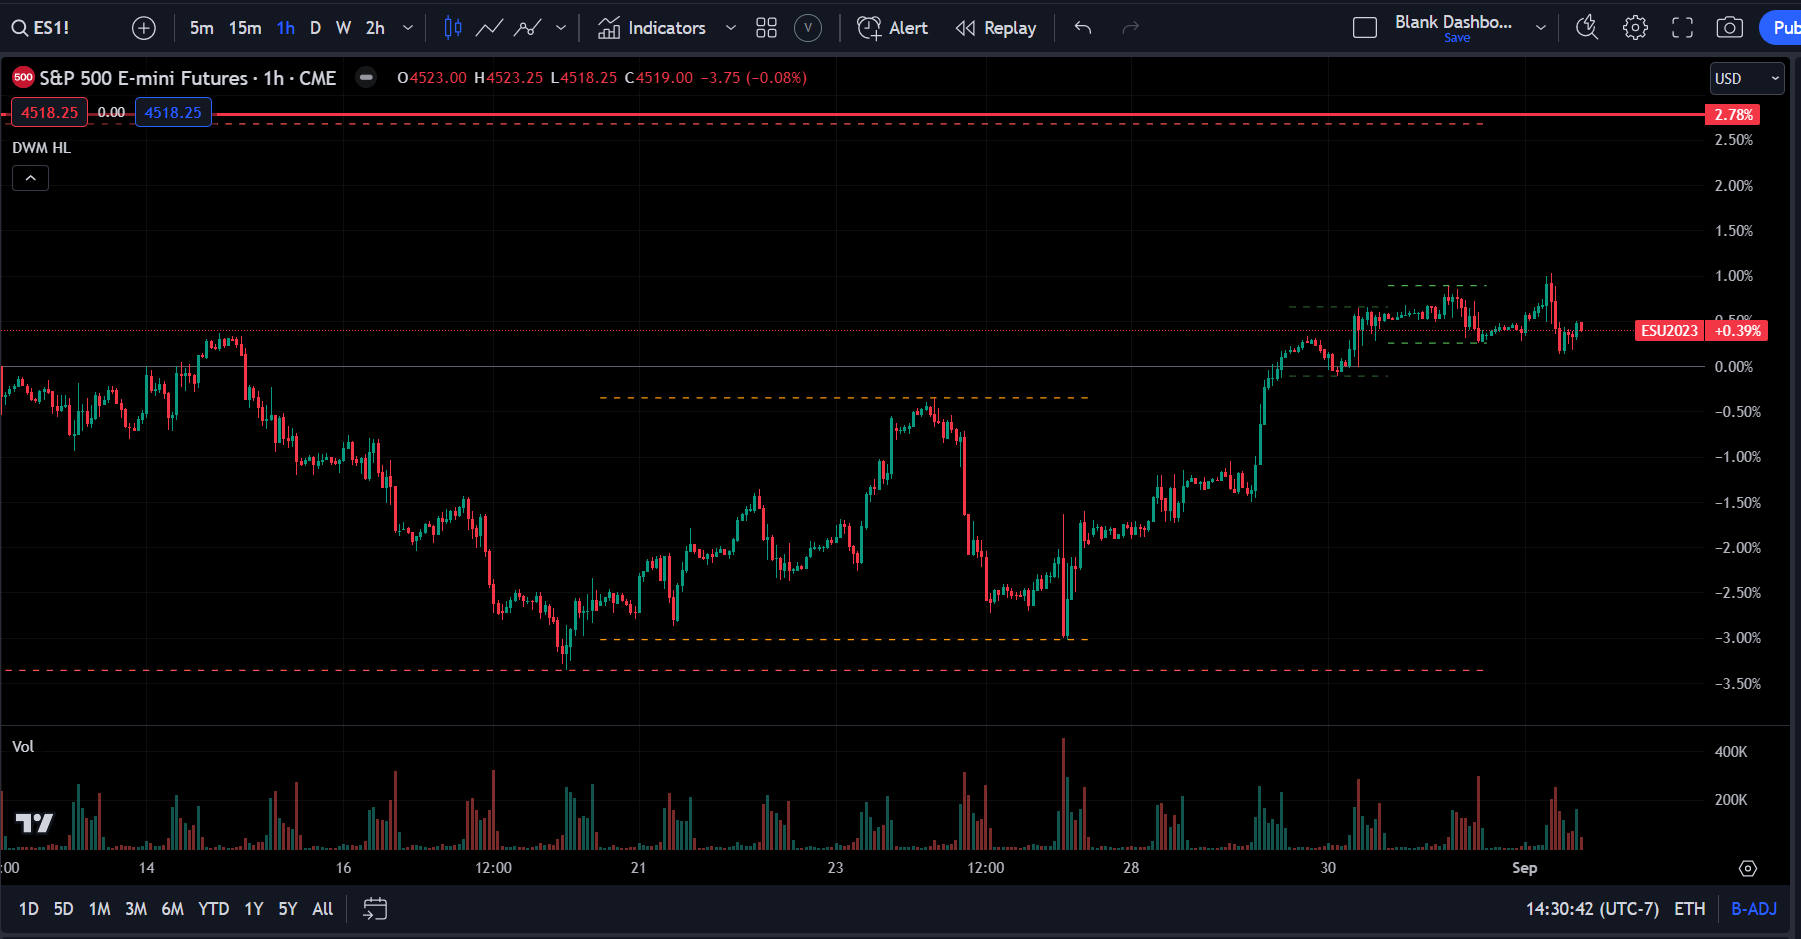
OHLC Levels with STDV and Returns:
Open, High, Low, and Close Levels are important. You want to watch these levels on the daily, weekly, and monthly timeframes. Additionally, you want to watch the standard deviation (STDV) and returns that take place between these levels.
Bringing It Together:
3 things to pull these variables together:
You want to identify the timeframe you are operating on so that you can generate signals on that specific timeframe.
Use the data points of Globex, Volume (VWAP/TWAP), and OHLC levels on multiple timeframes to begin identifying opportunities.
Examples of questions to ask:
What type of intraday characteristics occur during bull/bear markets?
What type of intraday characteristics occur during various levels in the VIX?
What type of OHLC levels are unlikely to be broken during a session? How can I use these to set my risk?
How does TWAP deviation from VWAP occur during specific periods of Globex? IF TWAP deviates from VWAP during the first half of the day, should I bet on mean reversion into the close?
If price has x type of move from the daily high while the price is y STDV above the weekly open, what is the likelihood a reversal begins to take place?
Use the papers to identify additional questions to ask and characteristics to examine (Hint: There are A LOT MORE).
What I can say is that if you begin thinking in these data points, it will provide you with a much clearer signal for executing your longer-term trades and you will begin to see a lot more intraday opportunities. Many times when there are specific shocks in the market, you will see specific temporary patterns that you can take advantage of if you identify them fast enough. For example, if commodities gap up in the overnight session, what is the likelihood of them continuing to rally during the trading session?
There is one final thing to touch on and that is option flow.
Options Flow:
The options market has clearly become a significant focus of both quant firms and retail traders. Before we get into it, here is the one thing I will say: if everyone is looking at option volume and open interest then you probably want to rethink how much edge you have here if you’re doing the same thing as everyone else.
To be clear, I think option flow is a significant part of the market and you need to watch it but you also need to realize that this is a single data point. 0dte market has become the majority of volume in the option market but using 0dte levels alone doesn’t always provide the edge people think they do.
When I think about watching option flow and open interest, I want this to be something IN ADDITION to the other signals I am already generating. If the notional open interest that needs to be delta-hedged is larger than the average daily volume, then we can see gamma squeezes. When I think about open interest levels, I don’t necessarily think of them as support and resistance but simply levels where a greater frequency of volume COULD take place. However, this needs to be weighed against how overall option positioning is netting out because a player might not be buying directional calls/puts at a single level.
If you want a helpful introduction to these ideas, Yes, I give a FIG... thoughts on markets from Michael Green/Profplum99 has a good video on it with T1Alpha.
Watching signals like IV/HV and the regimes those take place in can be helpful for projecting probable ranges in price, especially if you compare them with the other signals noted above.
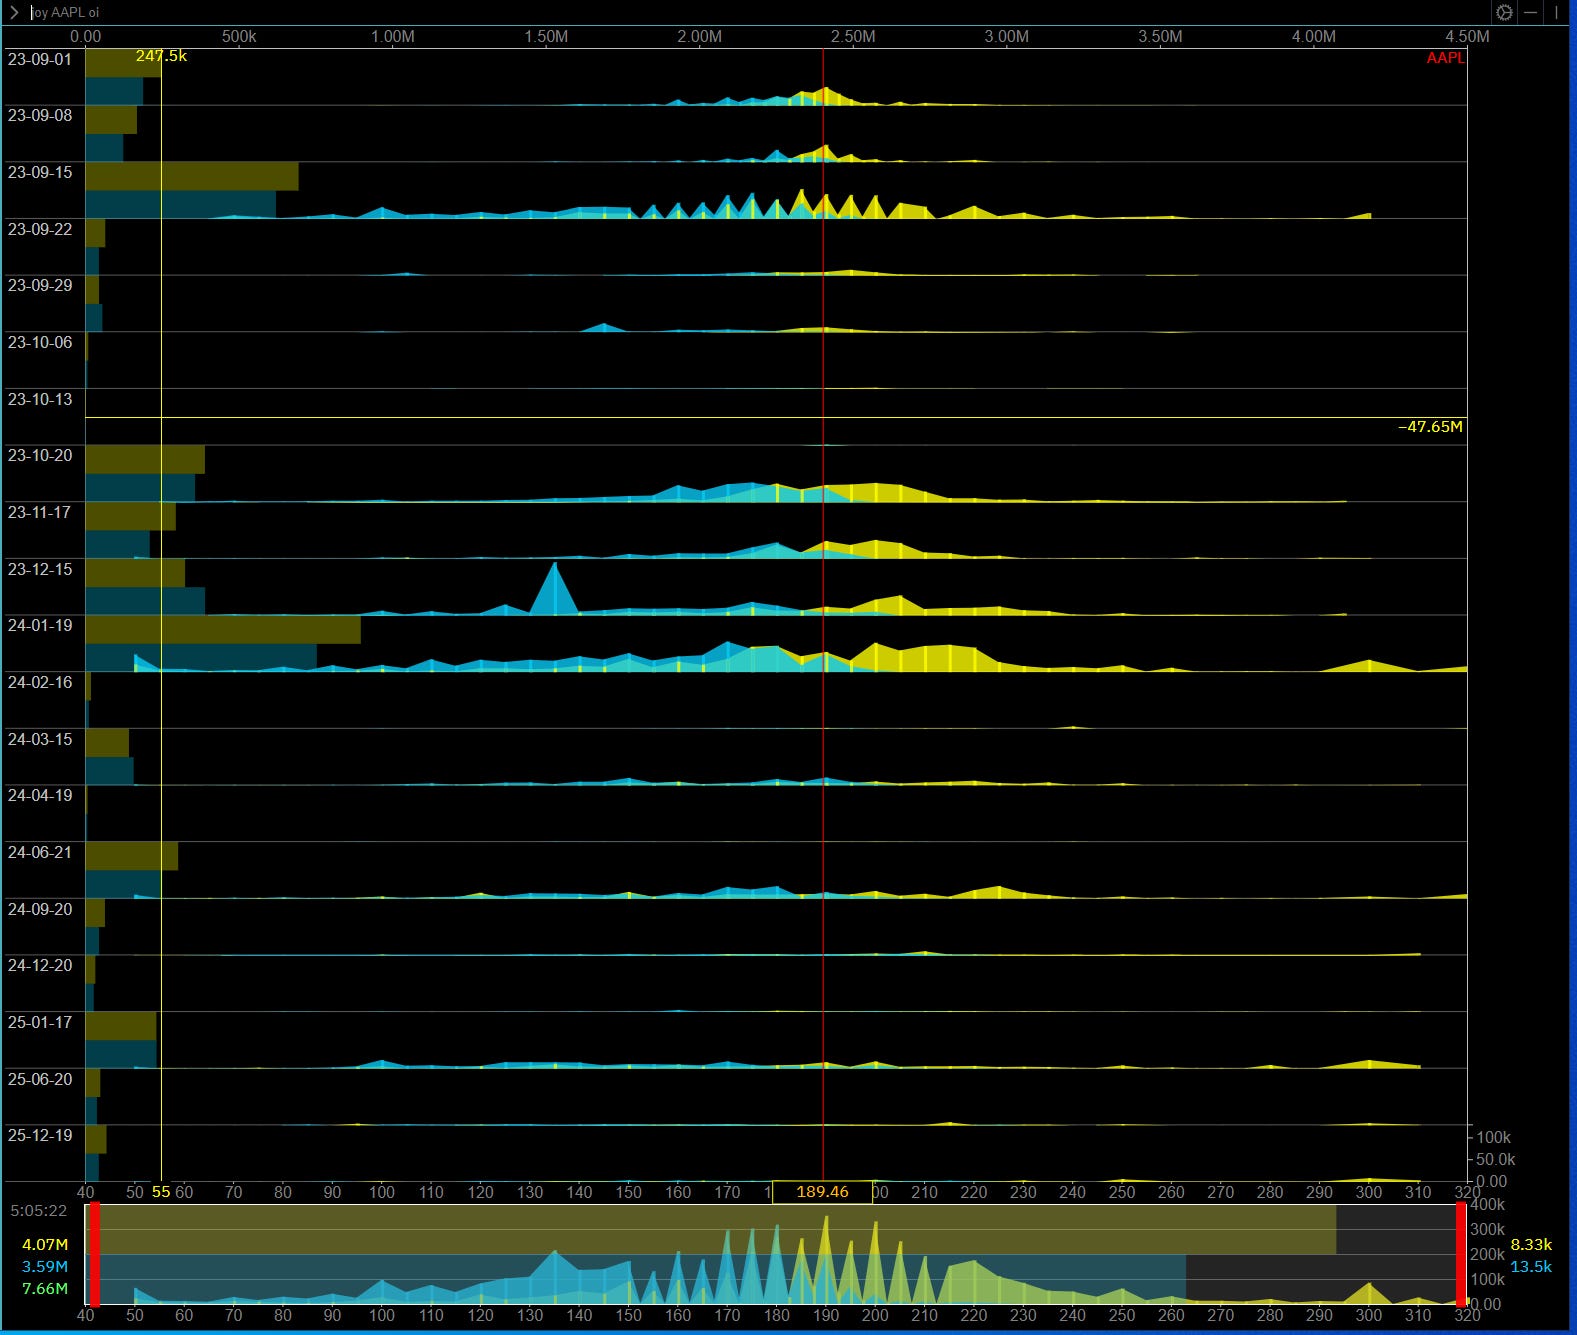
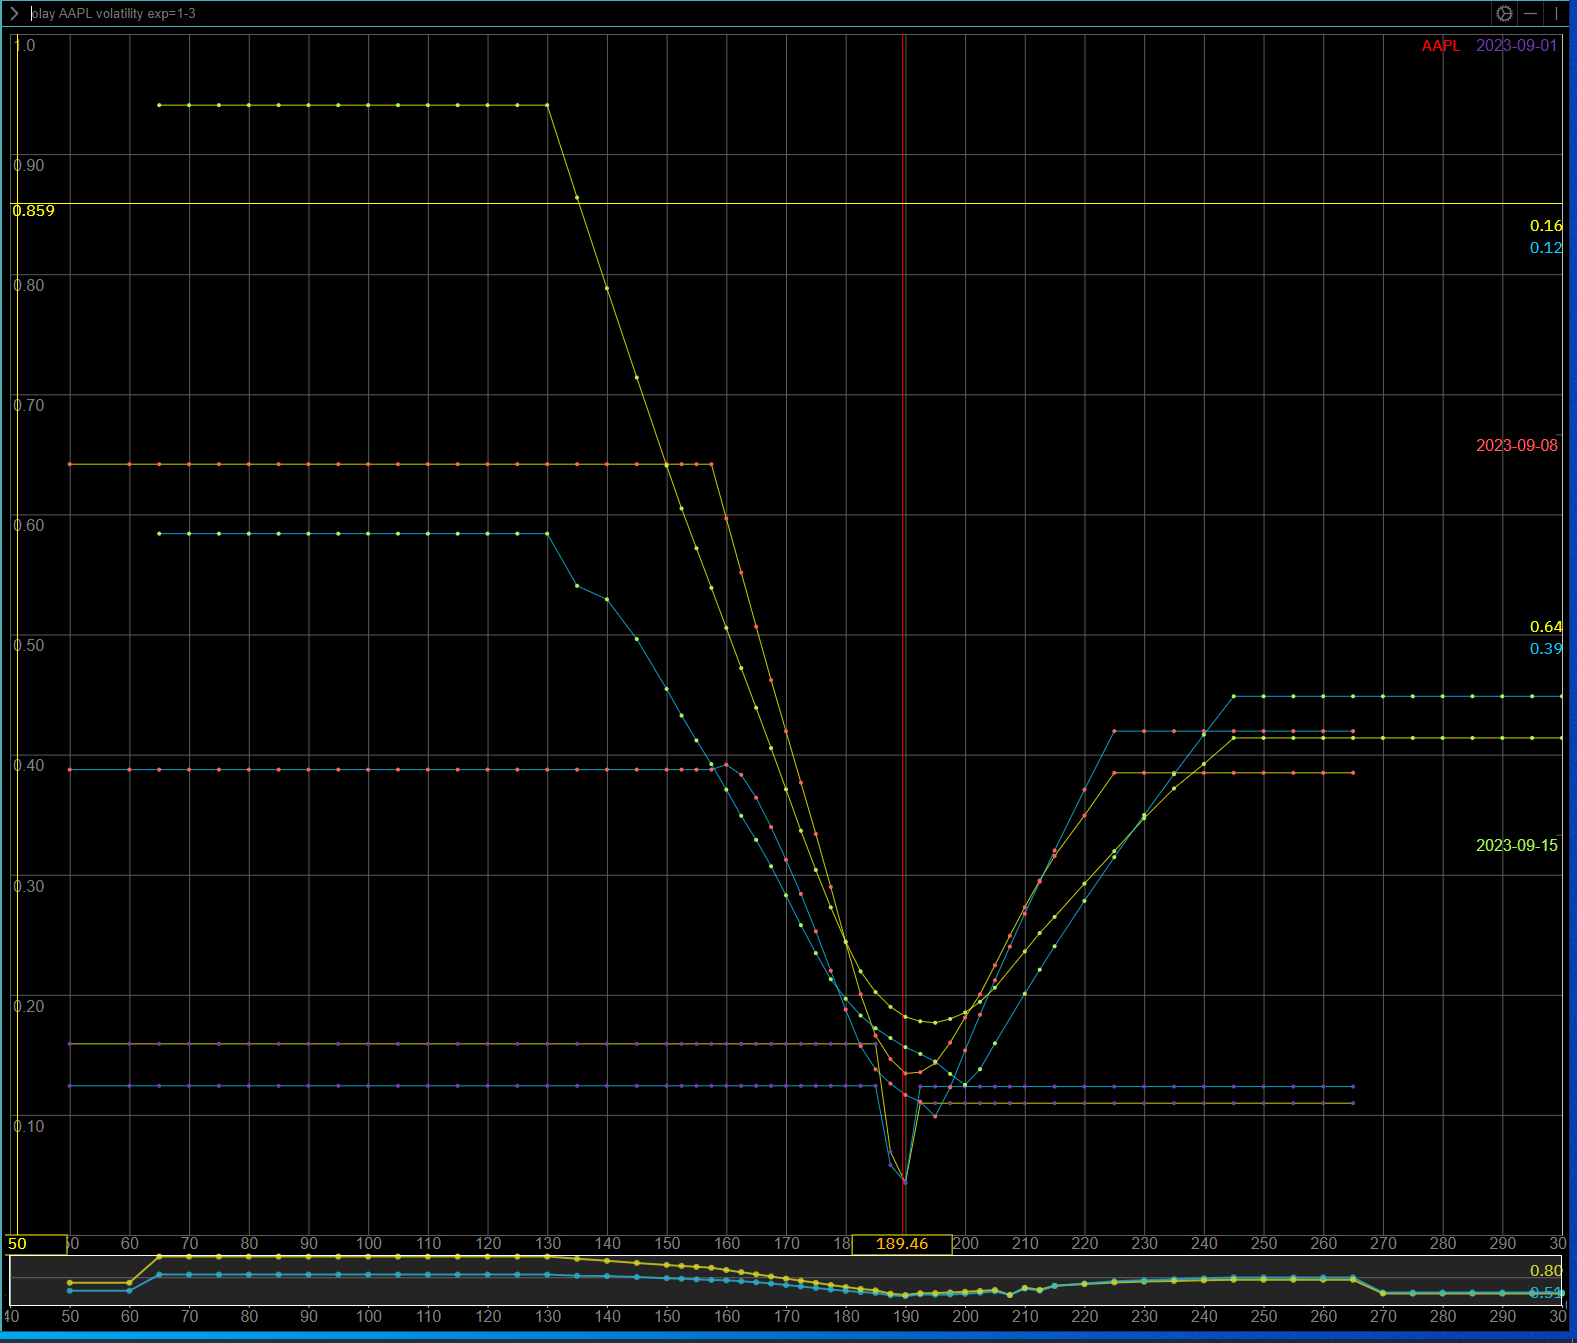
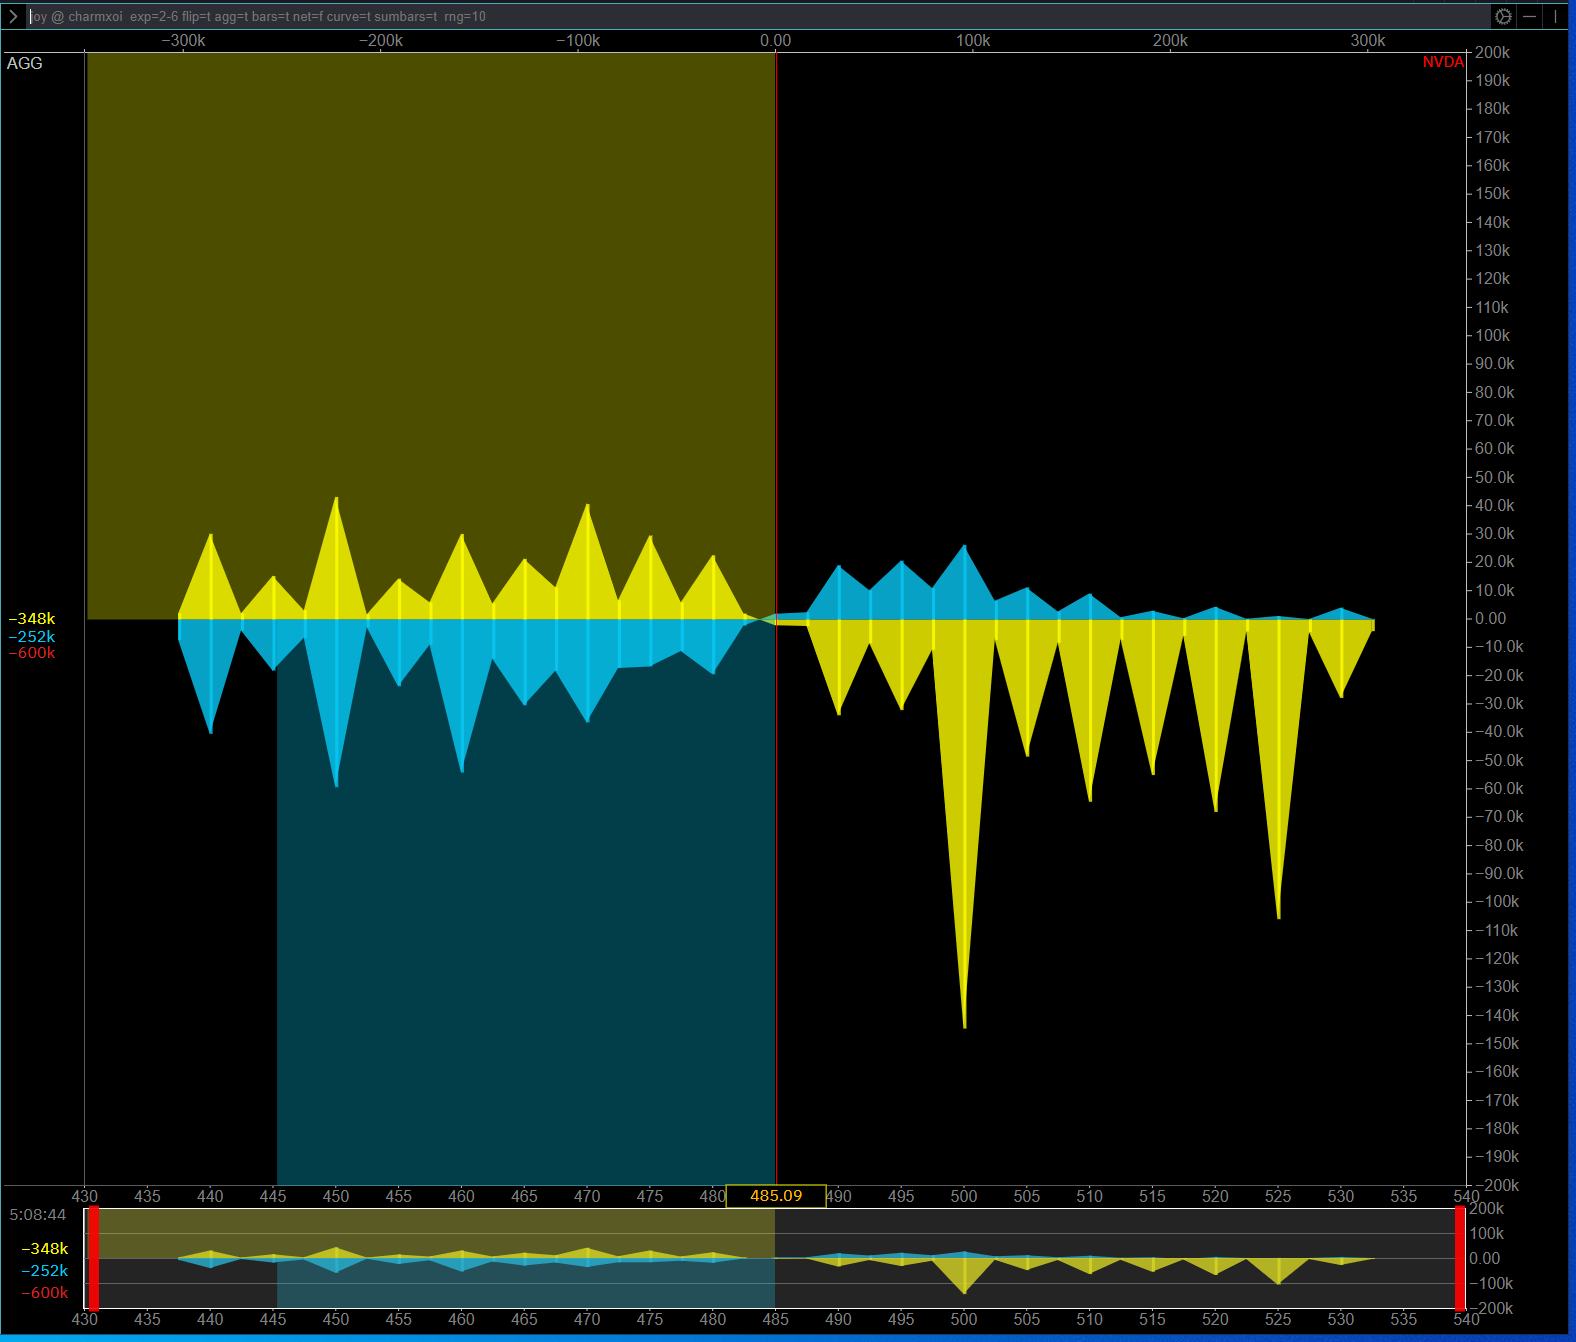
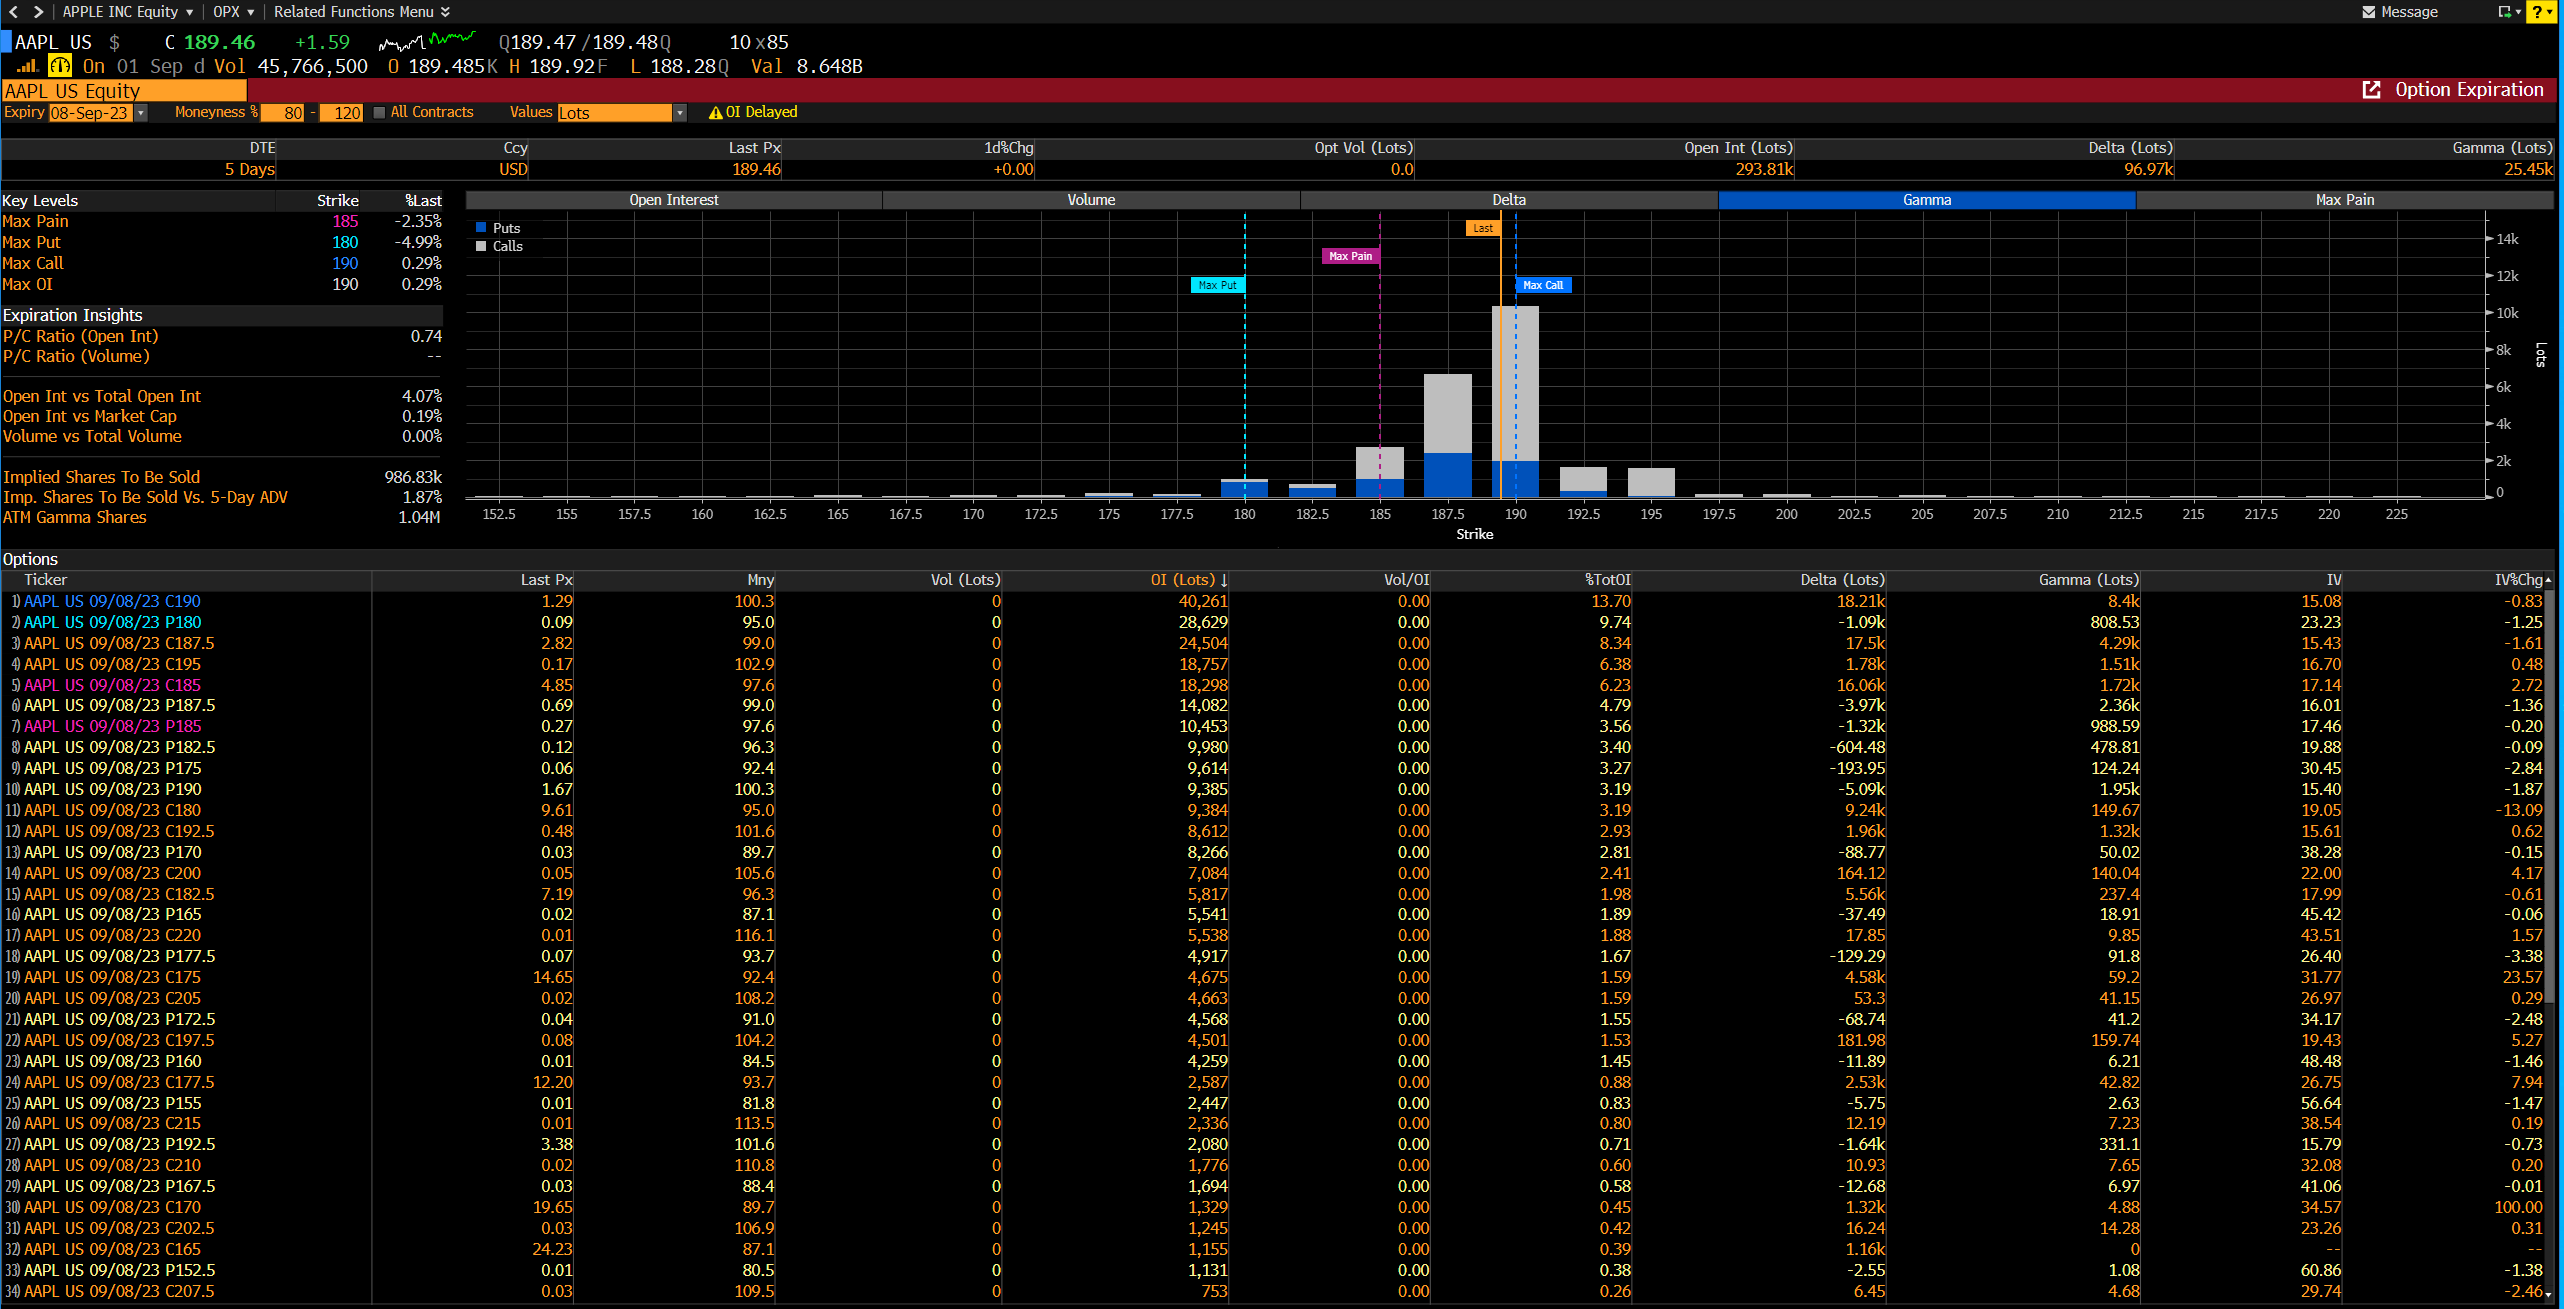
I personally use Convex Value because I think their terminal does a great job at modeling all of these option ideas. Here are some visuals:
Here is open interest across all AAPL expirations:
Here is the distribution of implied vol on AAPL:
Then the terminal allows you to net out and calculate specific open interest levels:
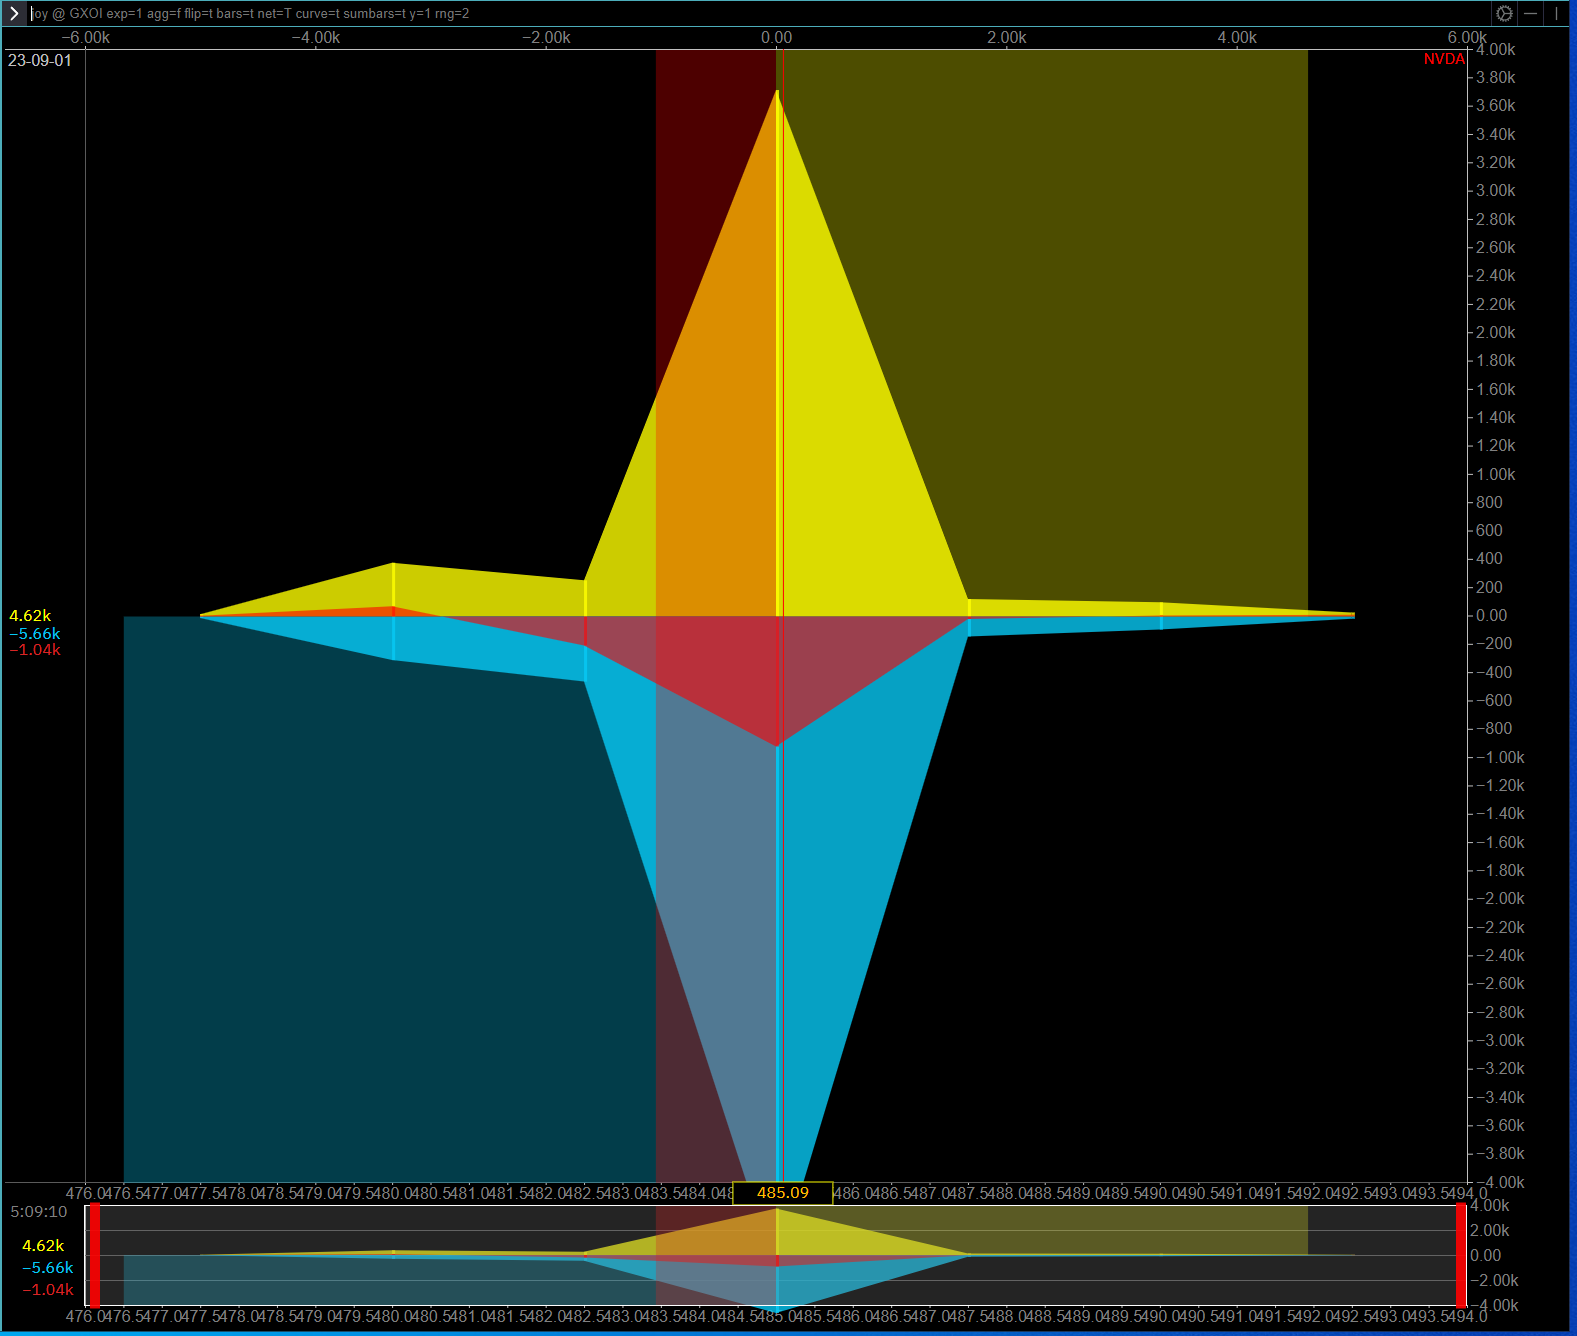
And then here is an example from Bloomberg:
And you want to watch all of these flows in connection with the option expiration calendar: https://www.cboe.com/about/hours/us-options/
The main idea I want to communicate with options is that you still need to put in the work to find some specific advantage. You can’t just trade open interest levels as if they are support and resistance because you’ll get chopped up.
Conclusion:
Alright! We have covered a lot in this article. There are a lot of other things that are helpful in analyzing intraday price action but these are the main building blocks. If you begin digging into the ideas and resources above, you’ll begin asking the right questions and moving in the right direction.
At the end of the day, it is really about how you bring together all of these moving parts. I am not sharing any secret alpha by sharing the moving parts. It is when you bring those moving parts together in perfect tension and match them to a specific temporal situation that can generate significant returns.
As I said in the interview with Jaymes the other day (link), this subtack is about building an exceptional foundation of how to think. You can begin to see that if you are simply able to ask the right questions for all of these moving pieces you can connect the dots correctly and generate outsized returns.
Everyone in the market is focused on chasing the next short-term trade. Focus on building an exceptional foundation and invest in yourself! The trades come when you invest in yourself and refine your knowledge base.

In the information age, you simply need to be at the right place, at the right time, with the right information to succeed
Thanks for reading!
Amazing article, I am currently working my way through and trying to gather as much info as possible. You mention a chapter from Advances in Financial Machine Learning about the dollar, ticks, etc. I have a PDF of the book but I can't seem to find that chapter, do you happen to remember what number the chapter was?