


In this report, I am going to cover HOW to think about CPI tomorrow in light of the PPI print today and the connect levels in assets.
The most recent CPI model has been laid out here:

And all of the updated Macro Tear Sheets for today are here:
Macro Views:
Remember where we are in the big picture, valuations in risk assets are higher which means they have more of a sensitivity to liquidity conditions. Valuations aren’t a tool of prediction but the way in which we quantify our view on liquidity.

So we should ask, what is happening to liquidity right now? Liquidity is made up of interest rates and also the quantity of money in the system. Inflation expectations and real rates drive interest rates (read educational primers here for more on this: Link and Link). The chart below is of the 10-year inflation swap which has moved up since the September lows. Inflation expectations have been moving up marginally which is putting downward pressure on liquidity.

One of the things we touched on with Lord Fed was how all of the Fed watchers misinturpret who the actual driver in markets is. Does the Fed drive interest rates or does the long end drive the Fed?
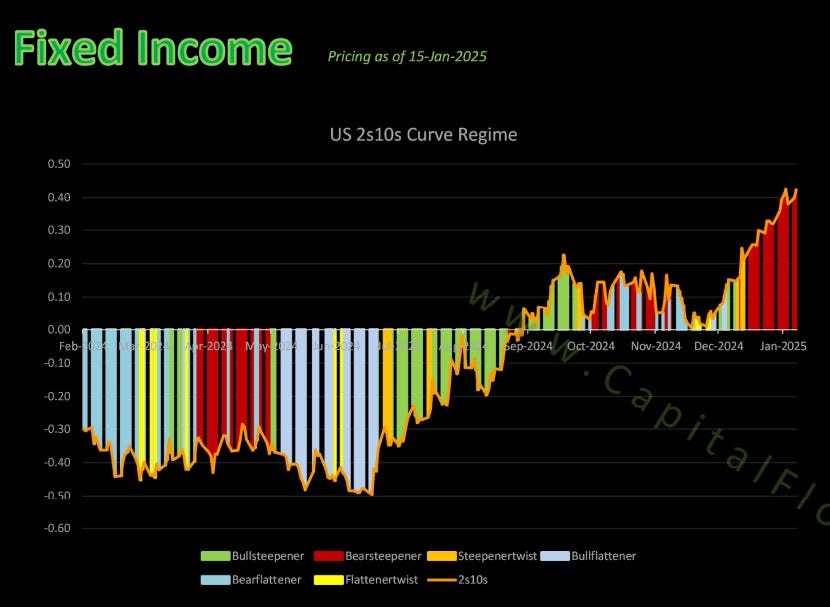
It is clear that the recent bear steepening (red regime in the chart below) has become an input into the Fed’s decision-making. (this chart is from the Fixed Income Tear Sheet above):
How does all of this connect to the CPI print? Well there is a reason that people are saying “good news is bad news.” When we have a higher-than-expected labor print (like NFP or JOLTS last week), it can most certainly cause equities to sell off because most of the realized returns in the S&P500 are from valuations and NOT earnings. The “good news is bad news” narrative is about a SHIFT in the underlying drivers of the S&P500 (see primer on equities here: Link).
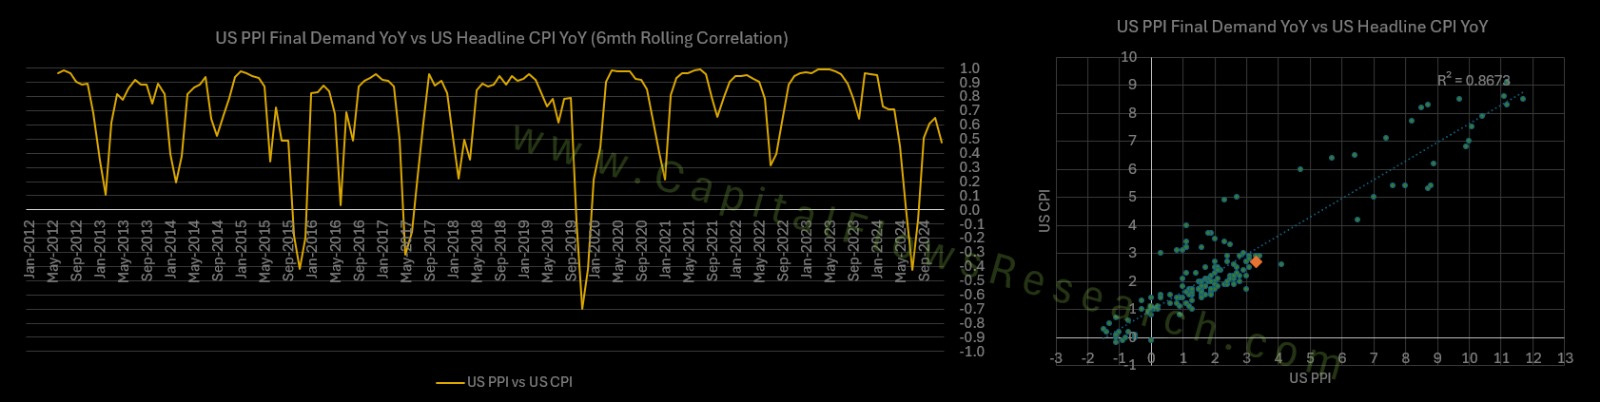
So the CPI prints are directly connected to PPI prints. They have a high degree of correlation because they are mapping different parts of the SAME system. You can see the correlation and clustering:
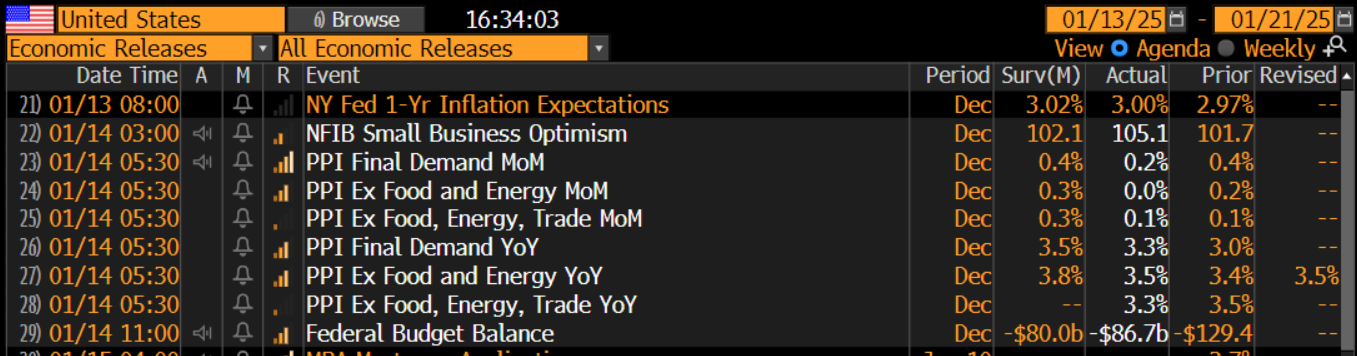
The PPI print came out BELOW expectations which likely decreases the probability that headline CPI comes in ABOVE expectations.
The main focus on CPI continues to be CORE which was laid out in the macro report:
Comprehensive Macro Report

We are moving into CPI this week with the question, will the negative returns in equities continue, and HOW will rates function as the 10-year approaches 2023 levels?
The PPI print provides a marginal degree of insight for positioning but managers remain net short:

With the VIX elevated moving into it:

How does this connect to equities and trade opportunities?
Keep reading with a 7-day free trial
Subscribe to Capital Flows to keep reading this post and get 7 days of free access to the full post archives.