

Why Is Bitcoin Underperforming And When Will It Change?
The macro flows and positioning changes in Bitcoin

Why Is Bitcoin Underperforming And When Will It Change?
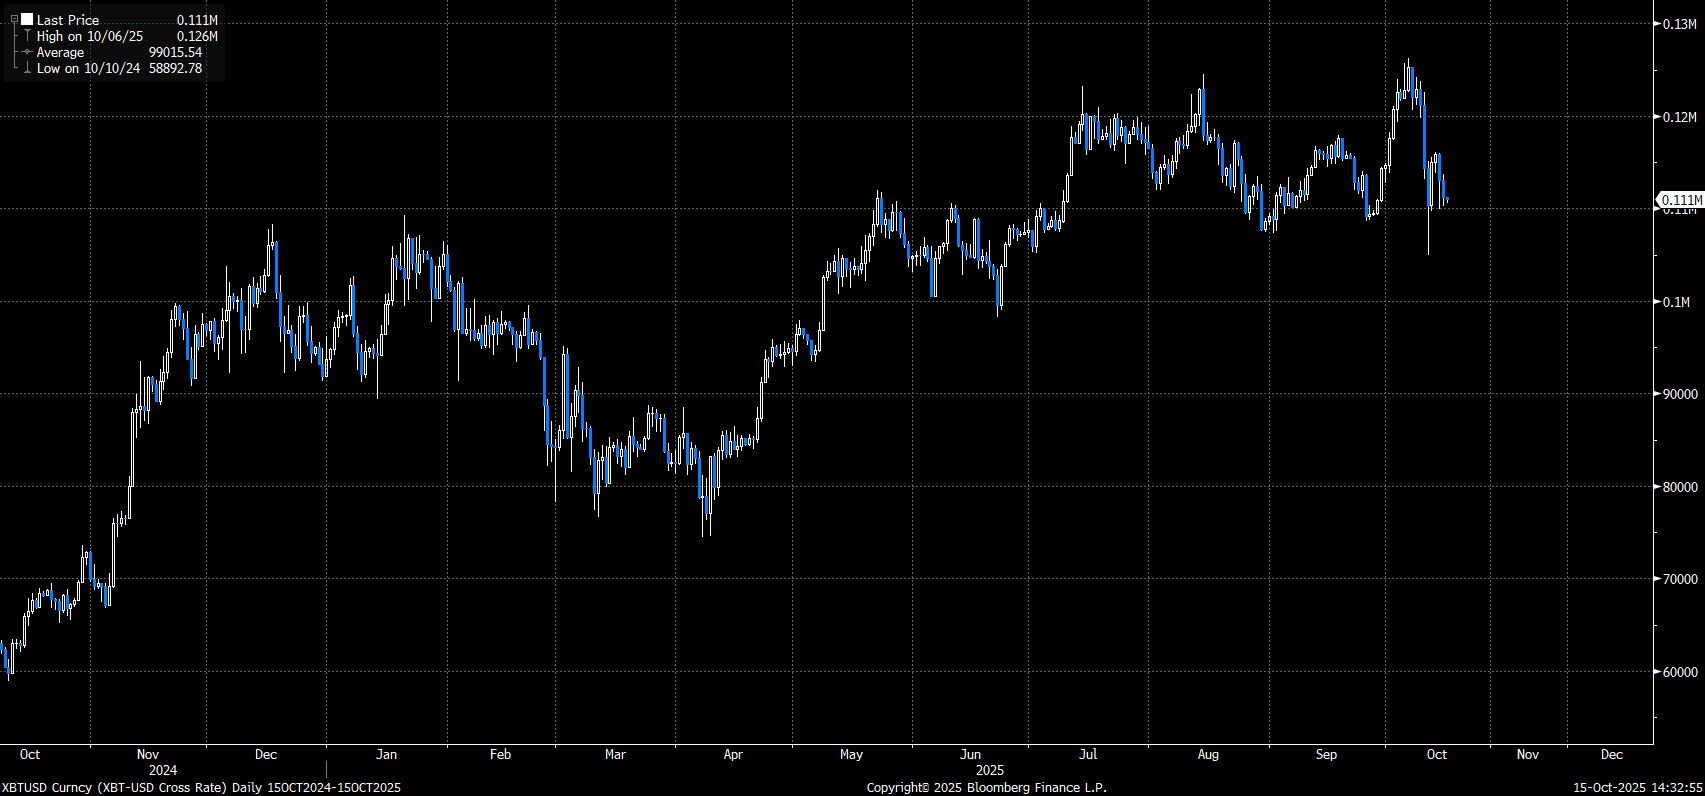
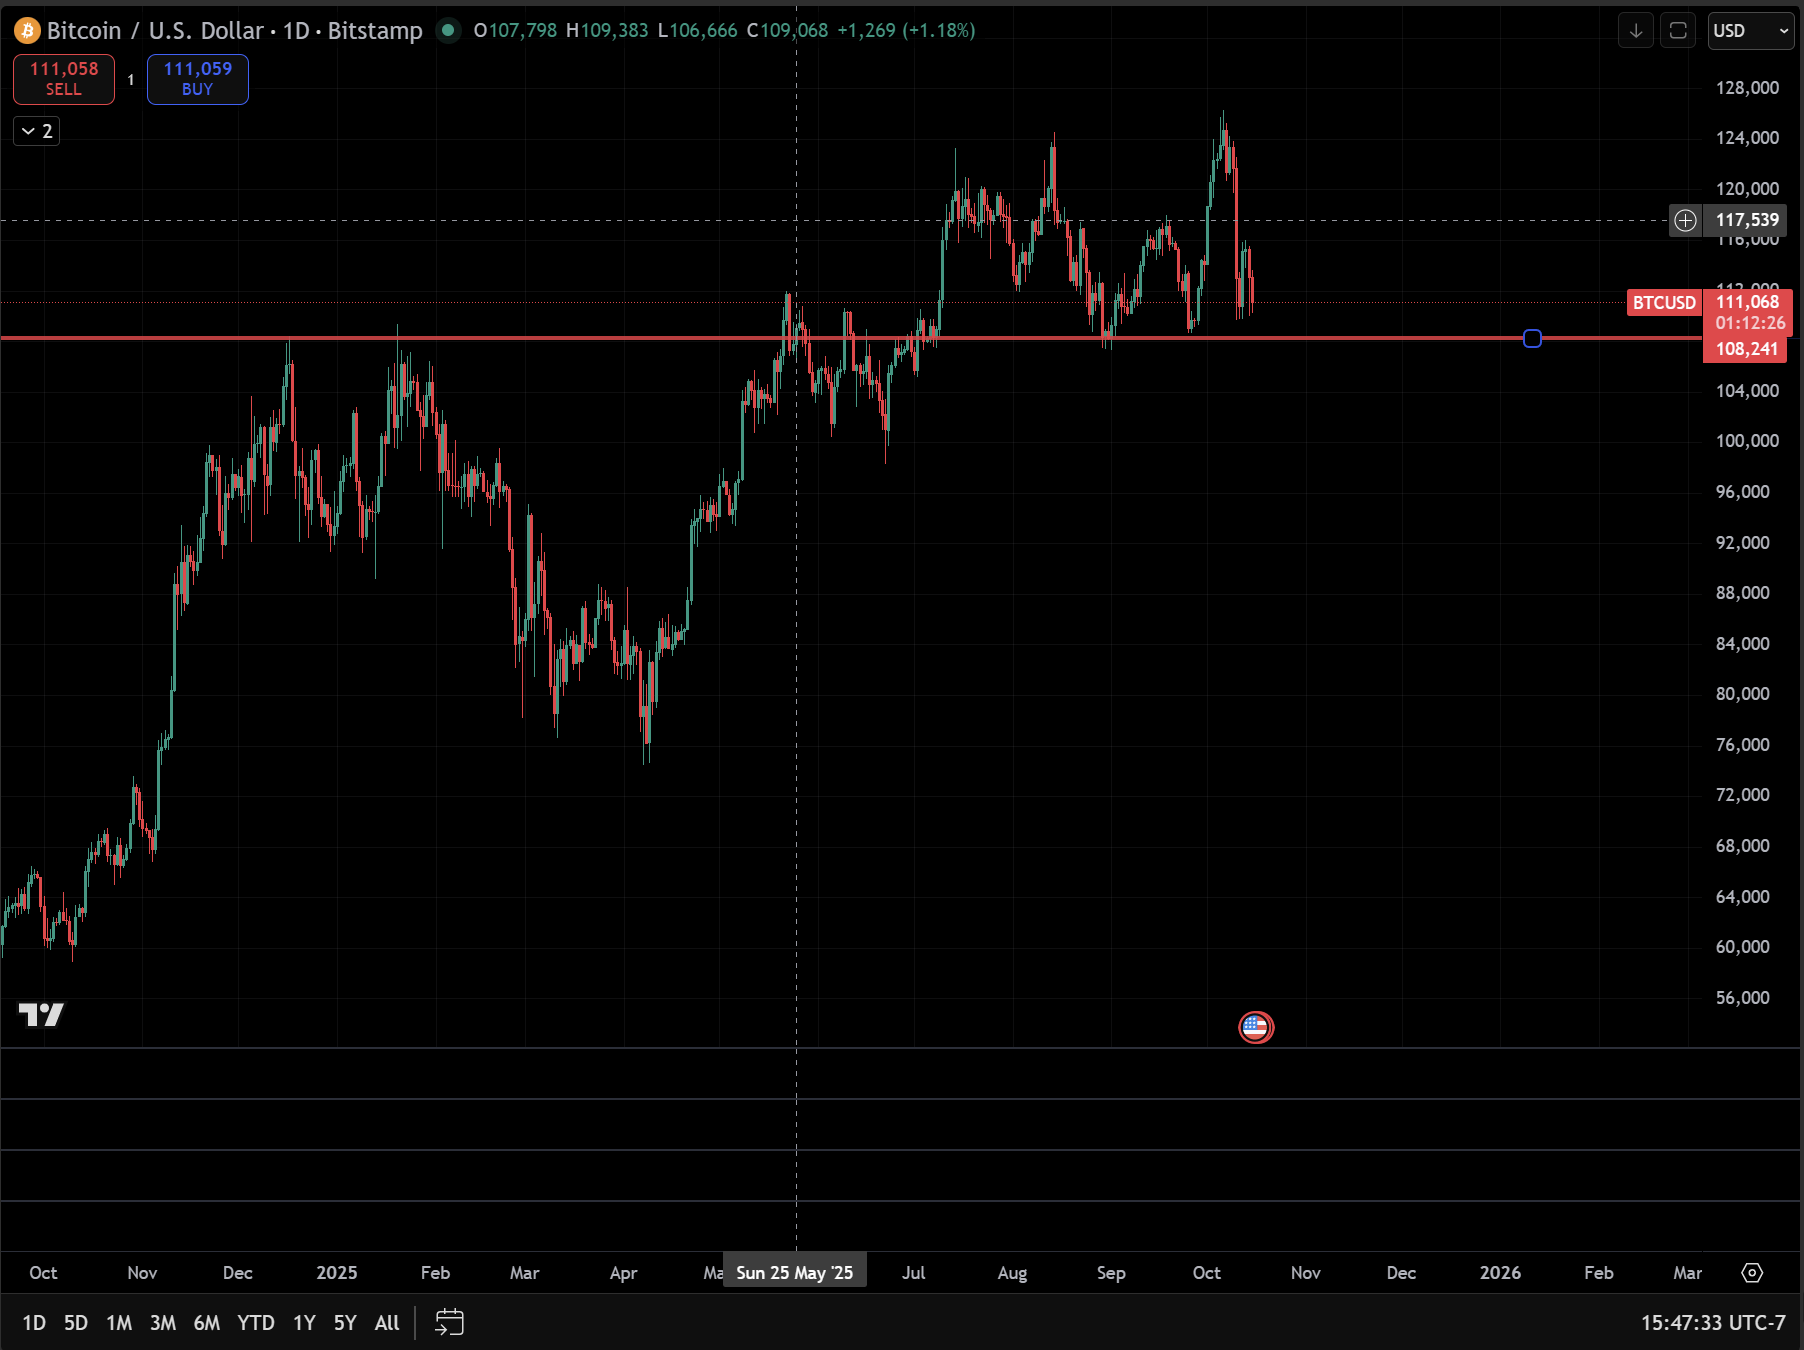
Bitcoin has been functionally range-bound since July, creating frustration among investors who hold an outsized position in the asset. The central question now is whether this sideways movement will persist, break lower, or finally surge toward 150k. These are not questions about Bitcoin’s long-term trajectory but about the path it takes to get there. Saying that Bitcoin will rise over the long term may well be true, with the burden of proof resting on Bitcoin itself, not its critics, but that view offers little value in interpreting real-time developments. To understand the path and short-term movements, one must grasp the underlying drivers behind why Bitcoin is rising or falling.
I have laid out the Bitcoin playbook and connected TradingView indicator for everyone here. You can reference this for a deeper dive on how these drivers work:
Bitcoin Indicator From Tradingview: LINK

Important Announcement:
Quick reminder, starting Friday at market close, there will be a price increase on the Capital Flows Substack. When you subscribe before then, you get to lock in the lower rate for all of the future upside on the Substack and the comprehensive macro analysis covering Bitcoin and every other major asset. (There are also two bonuses in the report linked below if you subscribe before Friday):

Bitcoin And Macro Liquidity:
Most Bitcoin maxis display extreme confirmation bias when analyzing Bitcoin’s price action. When predicting its price, the key point to understand is that Bitcoin operates along the same risk curve as other assets. It correlates with equities because it is a risk asset. There is a clear reason gold has rallied so much year-to-date while Bitcoin has not. People can ignore it if they wish, but central banks are using gold as a reserve asset, not Bitcoin. If Bitcoin were being used as a genuine hedge in this kind of balance sheet capacity, it would be rallying as equities sell off, just as gold did in Q1 and during the recent tariff-driven equity declines.
So let me walk you through how to think about Bitcoin here:
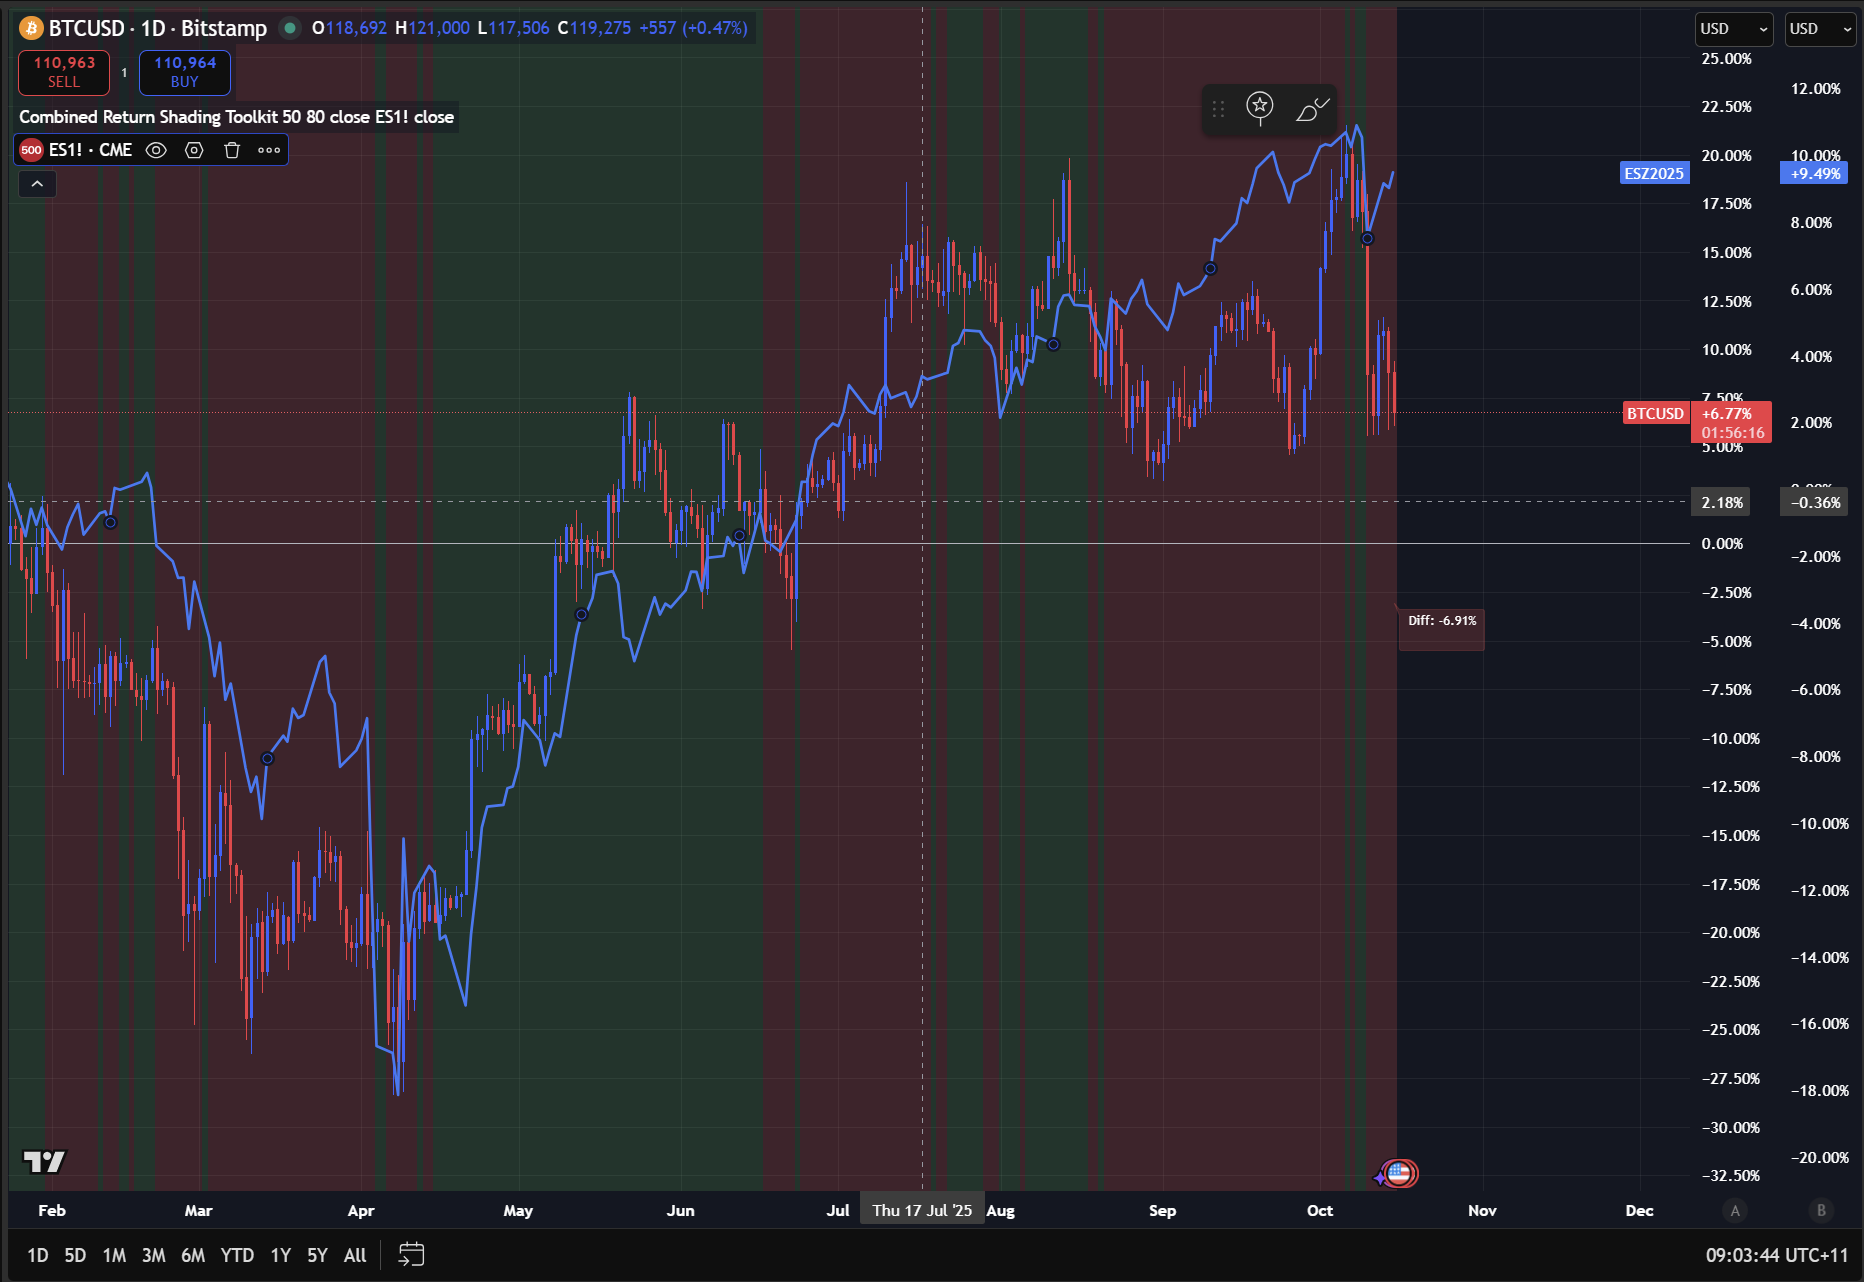
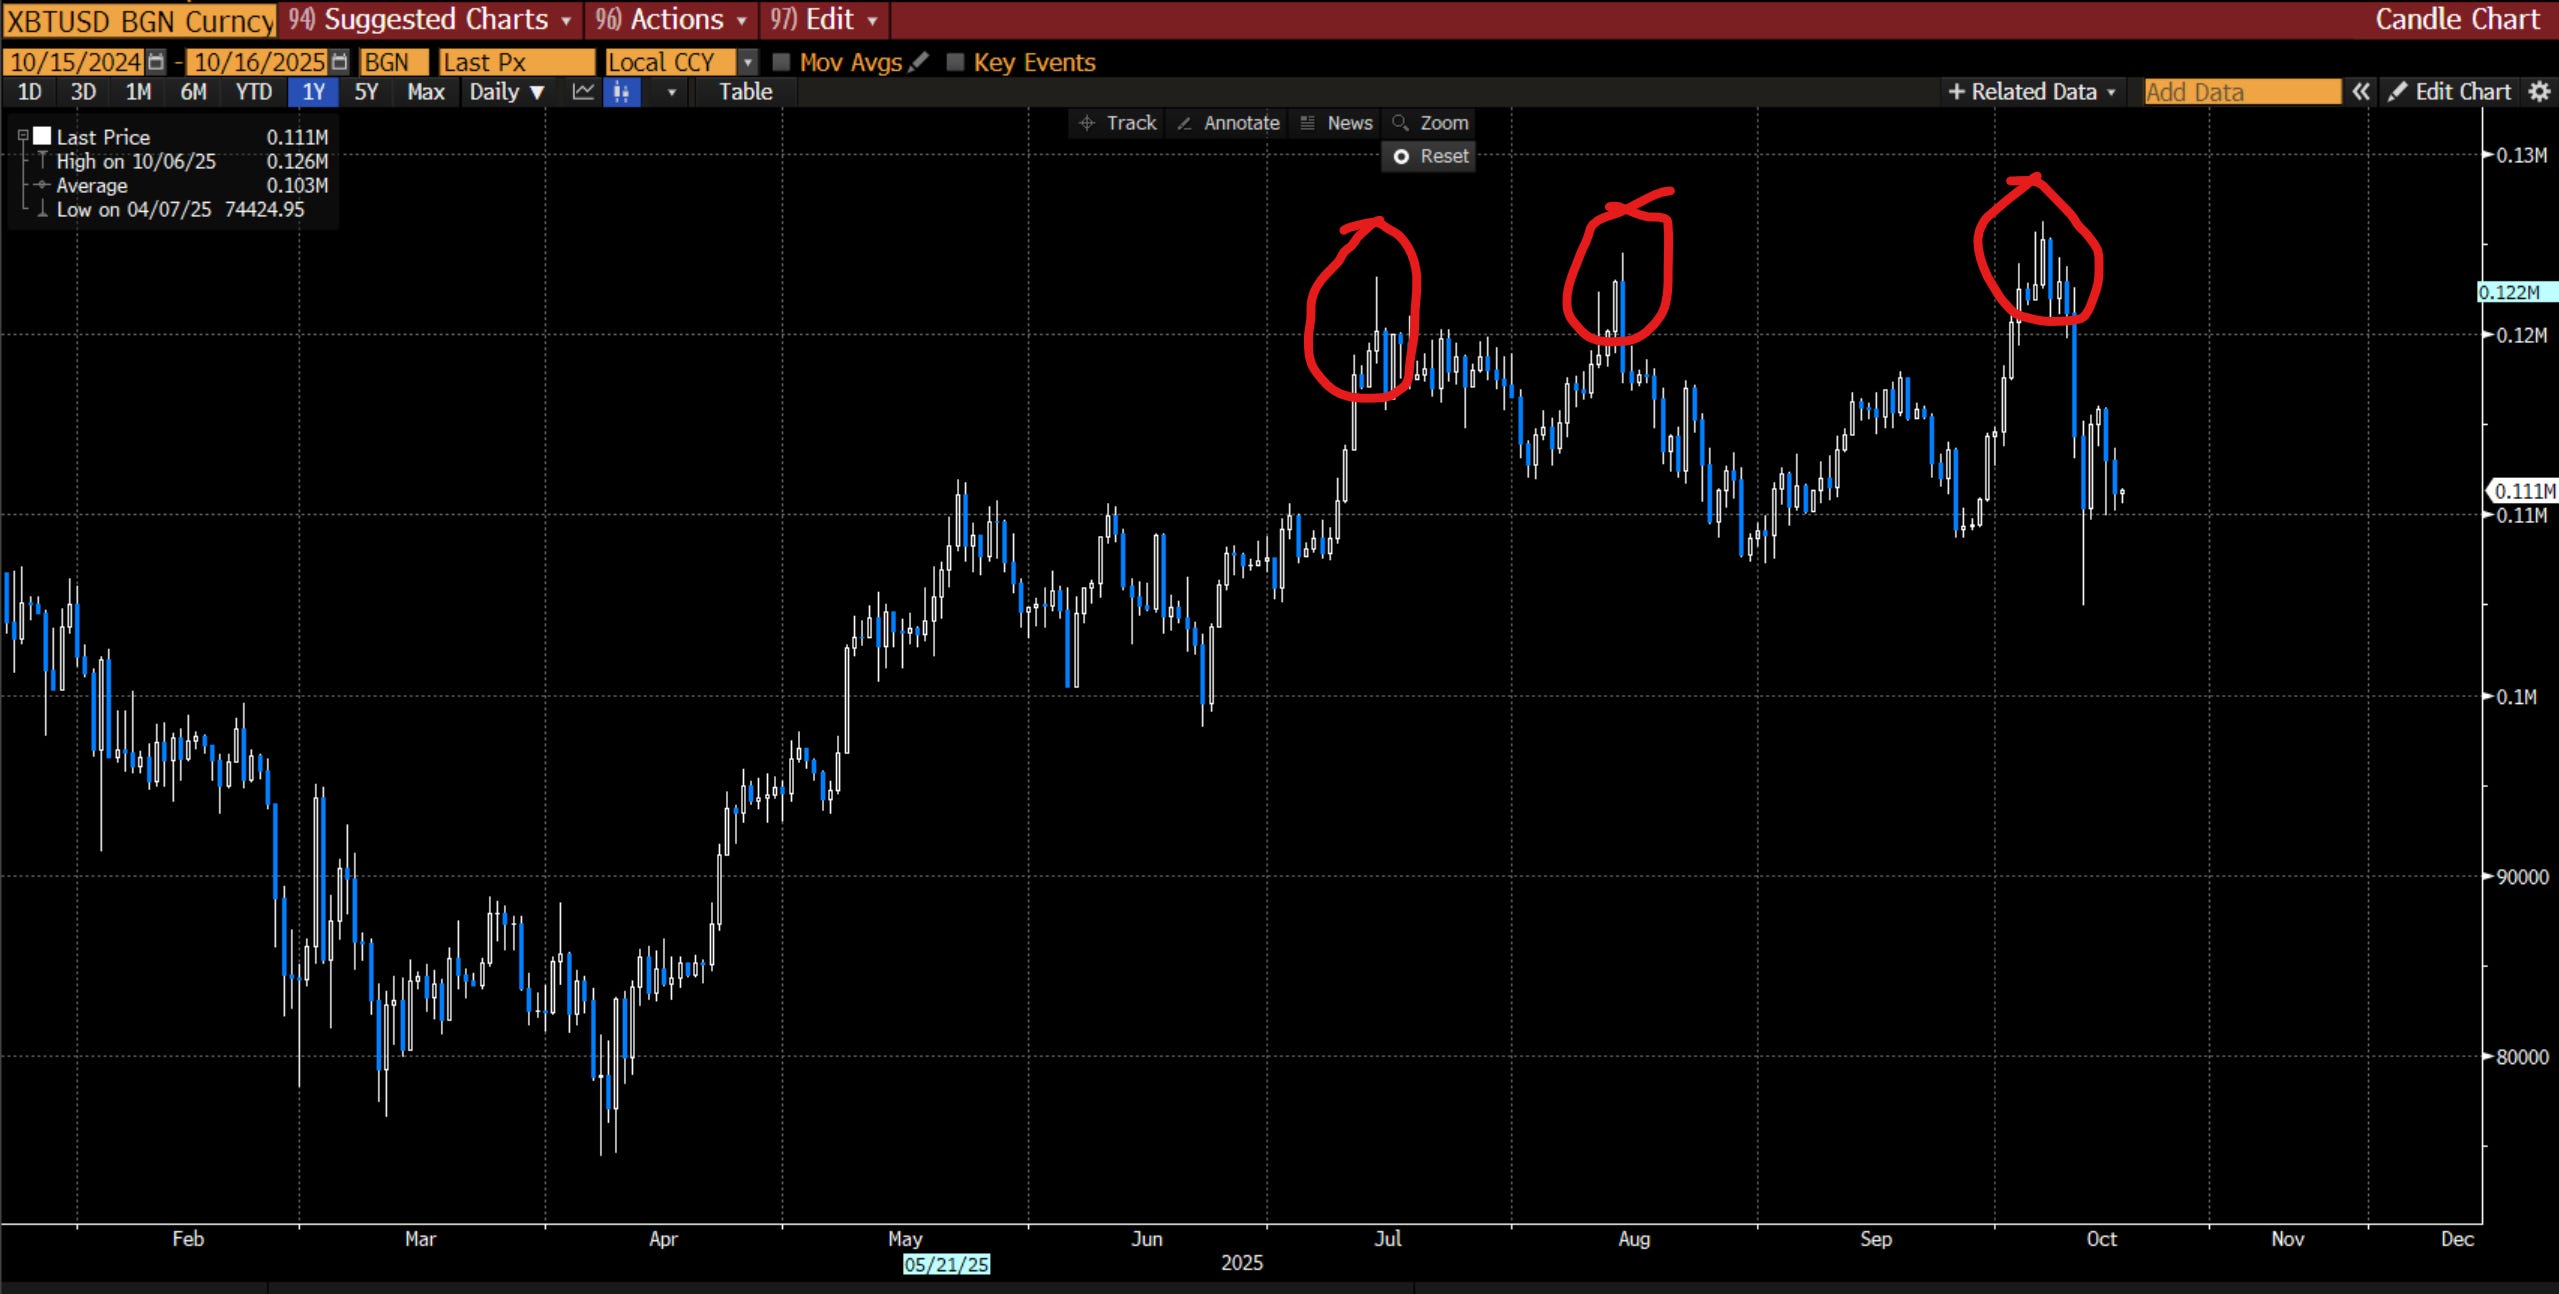
First, Bitcoin outperformed ES (S&P500 futures contract), rallying off the April lowsbut then began to underperform in July, which was the beginning of its neutral range. The chart below has the TradingView Script I linked above, where green shows BTC outperforming ES, and red shows Bitcoin underperforming ES. Most people will just adjust their timehorizon or look back to say Bitcoin always outperforms, which is literally the opposite thing you want to be doing. The way you can know WHY Bitcoin is rallying is by mapping all these incremental changes.
The other thing to note is that Bitcoin is also underperforming the Russell. The Russell has a lot more cyclical components in it, so it rallies when the economy is actually doing well and capital is moving out the risk curve. So think about it like this, macro liquidity in the system is expanding but its just not going to Bitcoin.
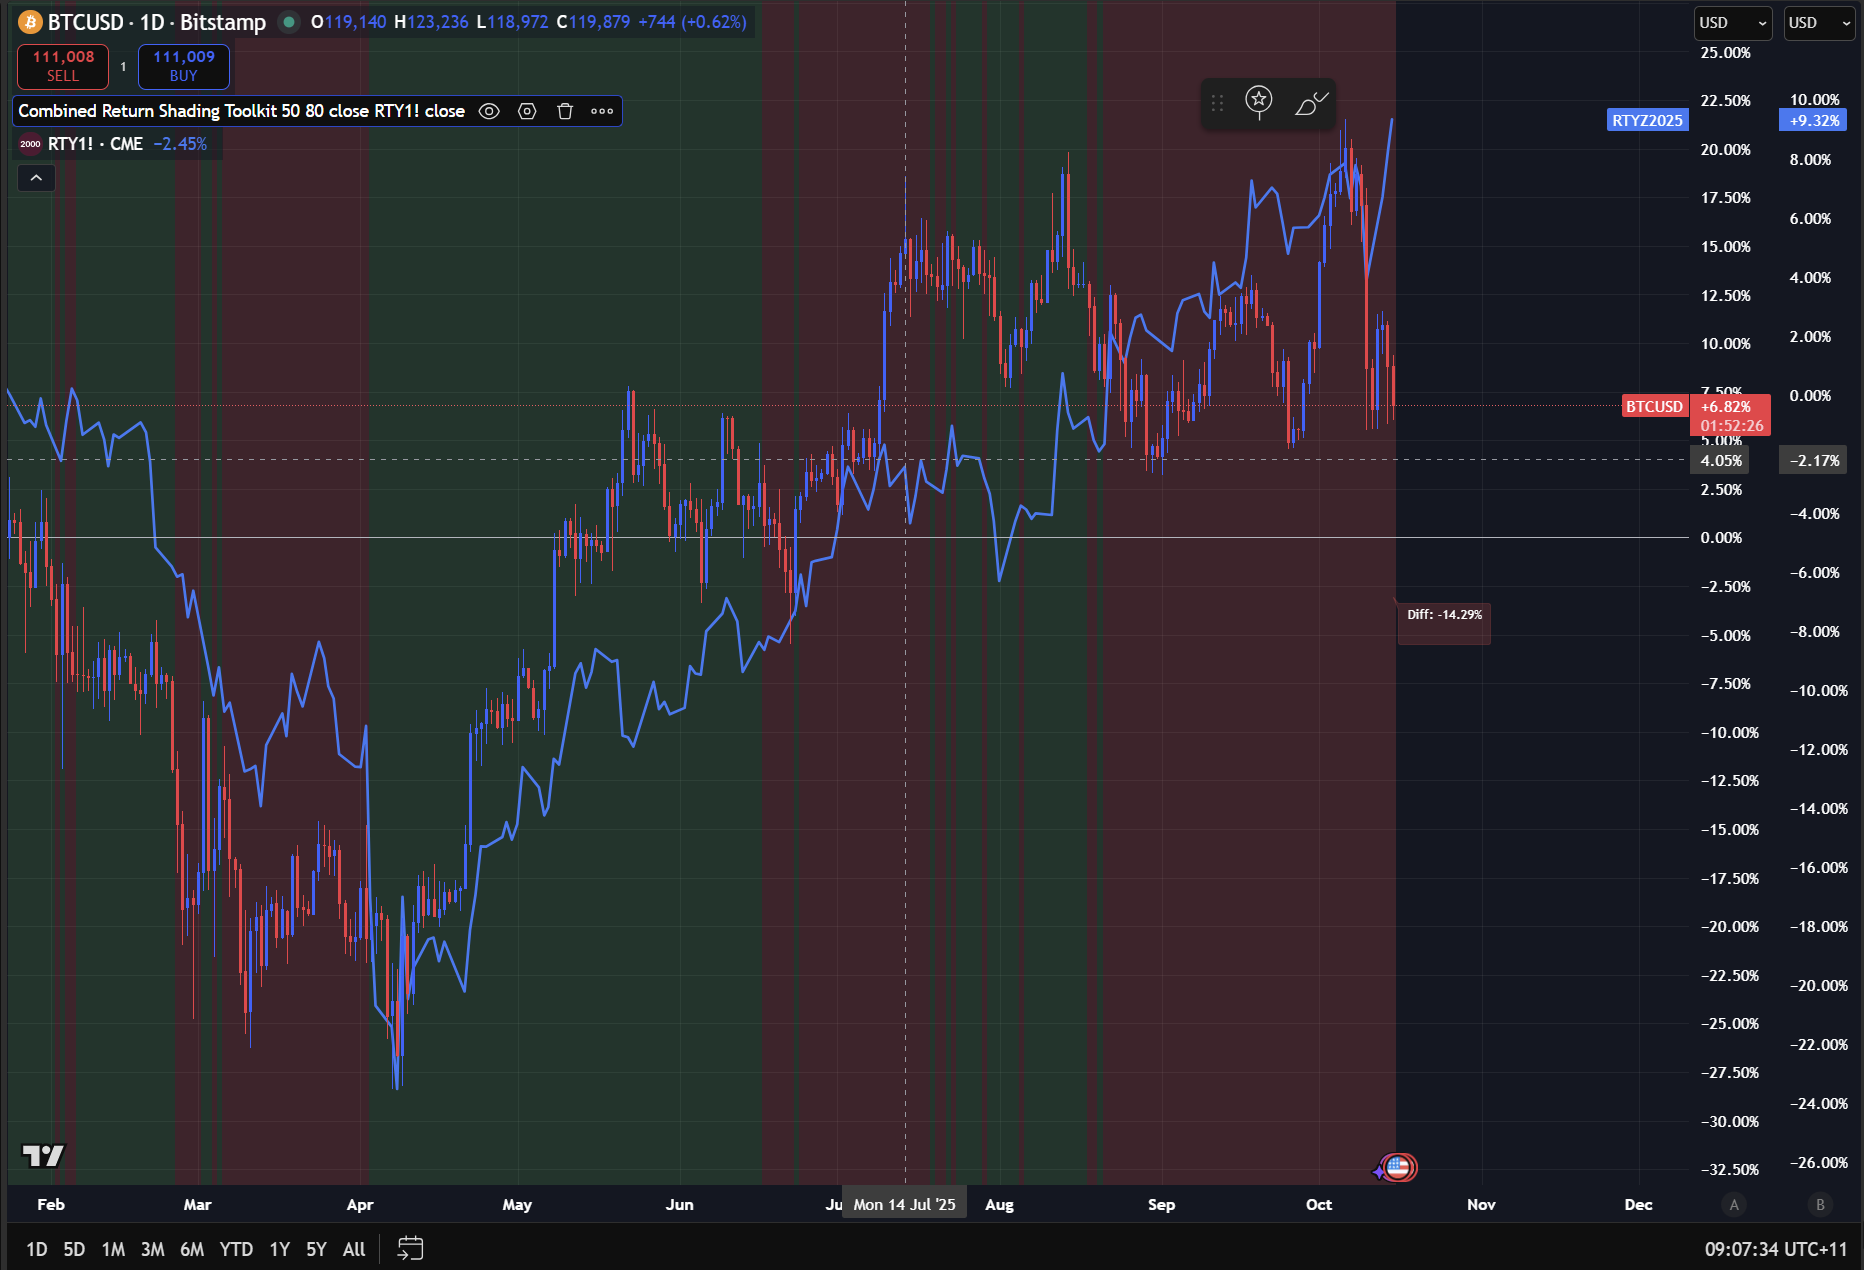
As I explained at Friday lows in equities, this is not a period of time where the economy is collapsing or macro liquidity is deteriorating. The credit cycle is still in full swing.

Capital is moving out the risk curve into things like ARKQ (tech and robotics ETF by Cathie Wood).
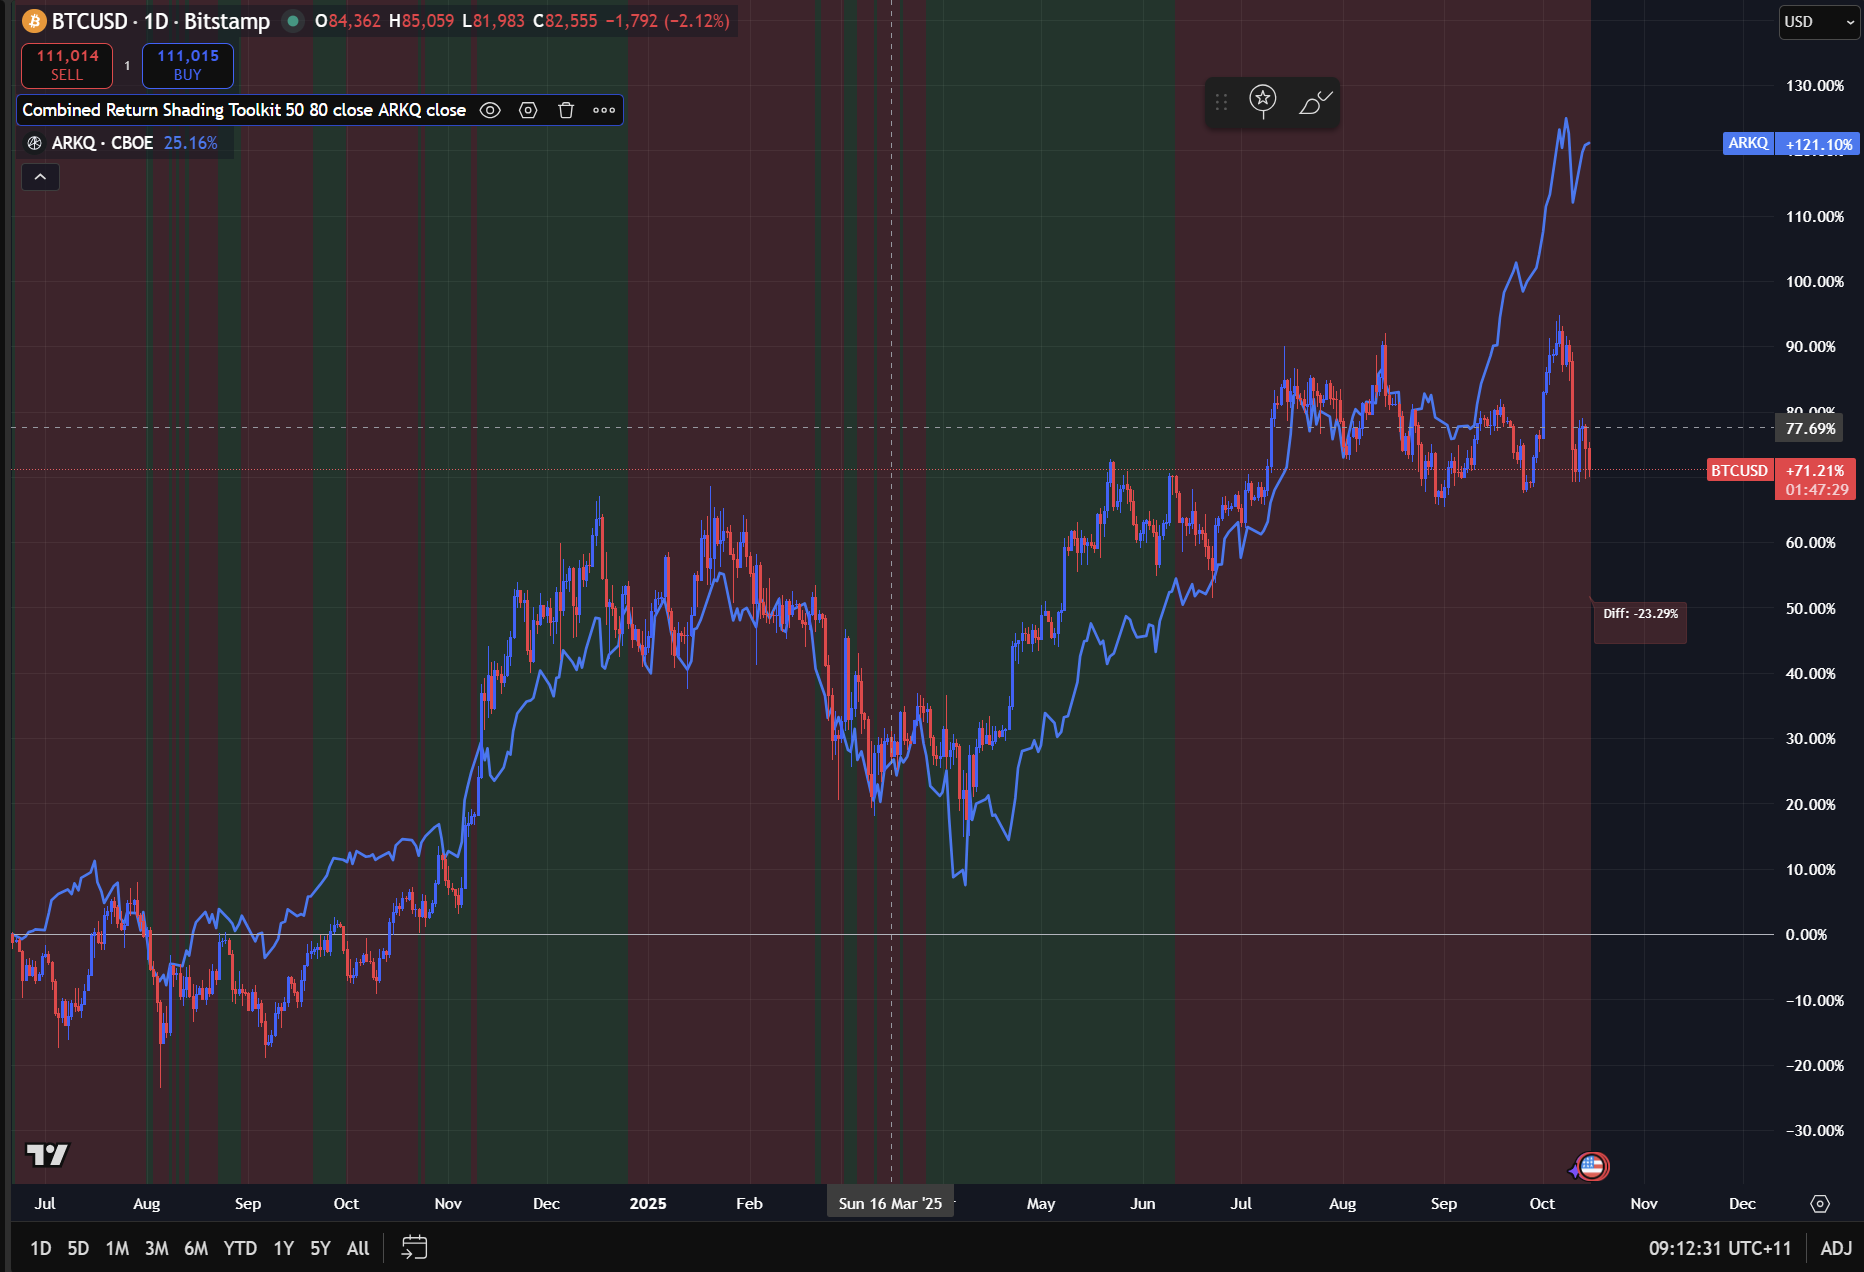
There is a lot more expected returns building in robotics and AI vs Bitcoin. This is something Citrini has done a great job covering:

So what has happened?
There are two major reasons in my view:
Macro liquidity is expanding, but it is clearly moving into things like gold/silver as real rates fall and into robotics, AI, and Semis as equity beta expressions. This has almost certainly contributed to the underperformance of Bitcoin.
The entire outperformance of Bitcoin off the April lows were linked to the wave of treasury companies trying to replicate Michael Saylor in MSTR 0.00%↑.
We know that regulators are already investigating front-running during this period of time, which is a major red flag.
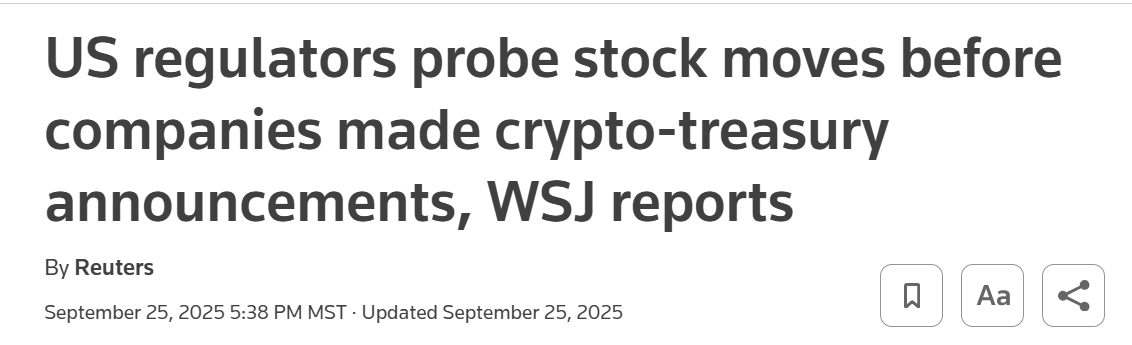
The treasury companies and expectations around them are fuctionally positioning being net long into a sell the news event. This positioning risk, overlapping with all of the capital chasing other assets, has created a perfect storm for Bitcoin to underperform as positioning unwinds.
WHERE Are we going?
I laid out my framework for HOW macro liquidity is likely to develop in these recent reports: (This is important to understand, given where we are in the credit cycle)


My view is that we are currently in a positive liquidity regime, and the warning signals I laid out in the reports above are not flashing red yet. I continue to run longs aggressively in equities.
The underperformance of Bitcoin has caused me to be less aggressive in my long positioning. What I am looking for to get more aggressively long Bitcoin (assuming macro liquidity remains abundant) is Bitcoin showing positive momentum on an outright basis and relative to other assets. So we remain range-bounded in Bitcoin on an outright basis, and we are approaching the bottom end of the range of Bitcoin vs ES, RTY, GC, SI, SMH (AI exposure), and ARKQ (bottom panel).
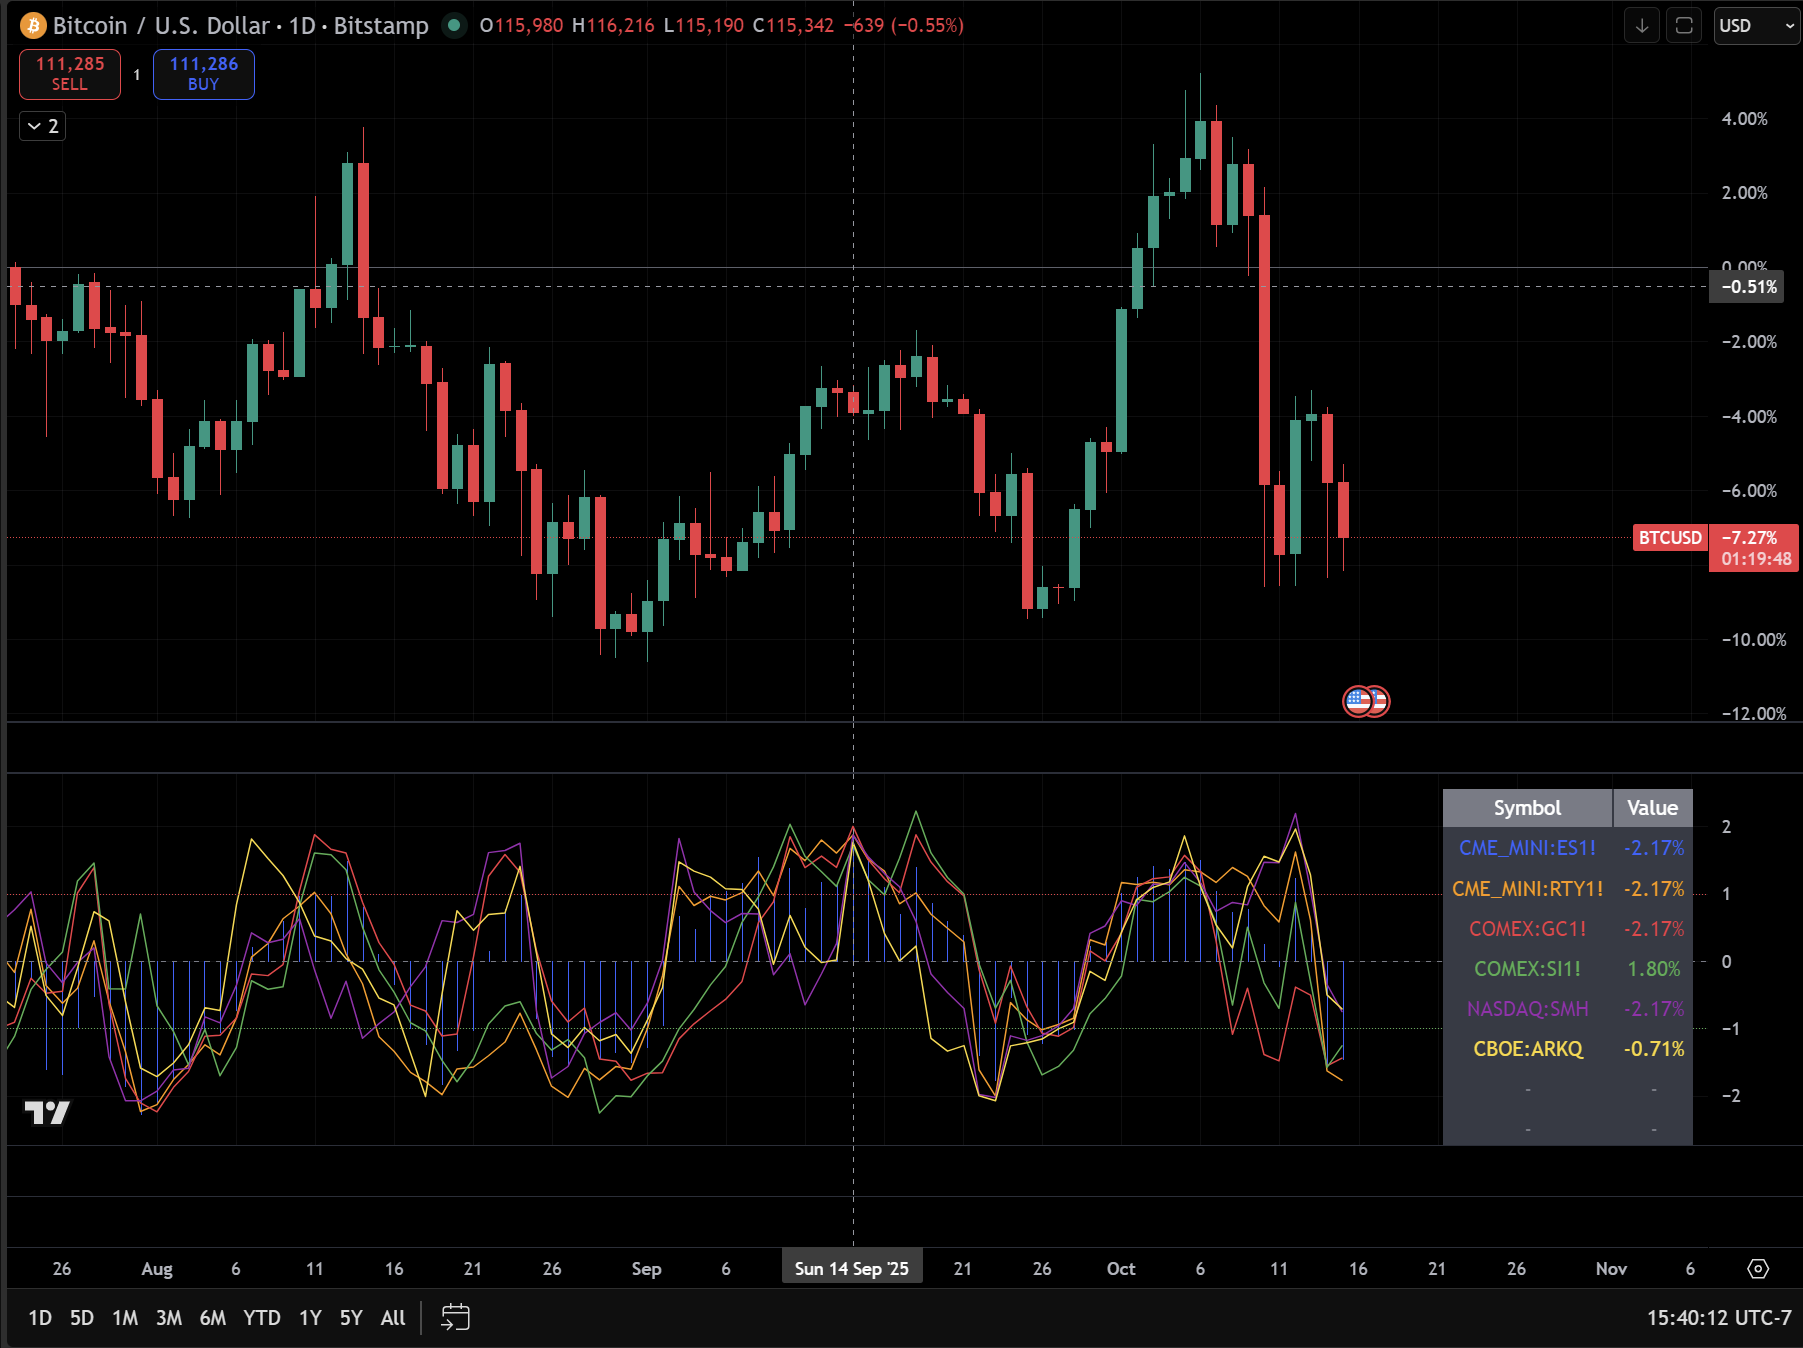
The next macro catalyst we have is FOMC at the end of this month, so I’m watching for any outright and cross sectional momentum shifts into and through that event. I would want to see a clear shift on an outright and/or cross-sectional basis on the hourly timeframe (chart below) to aggressively run a lot more leverage in my longs.
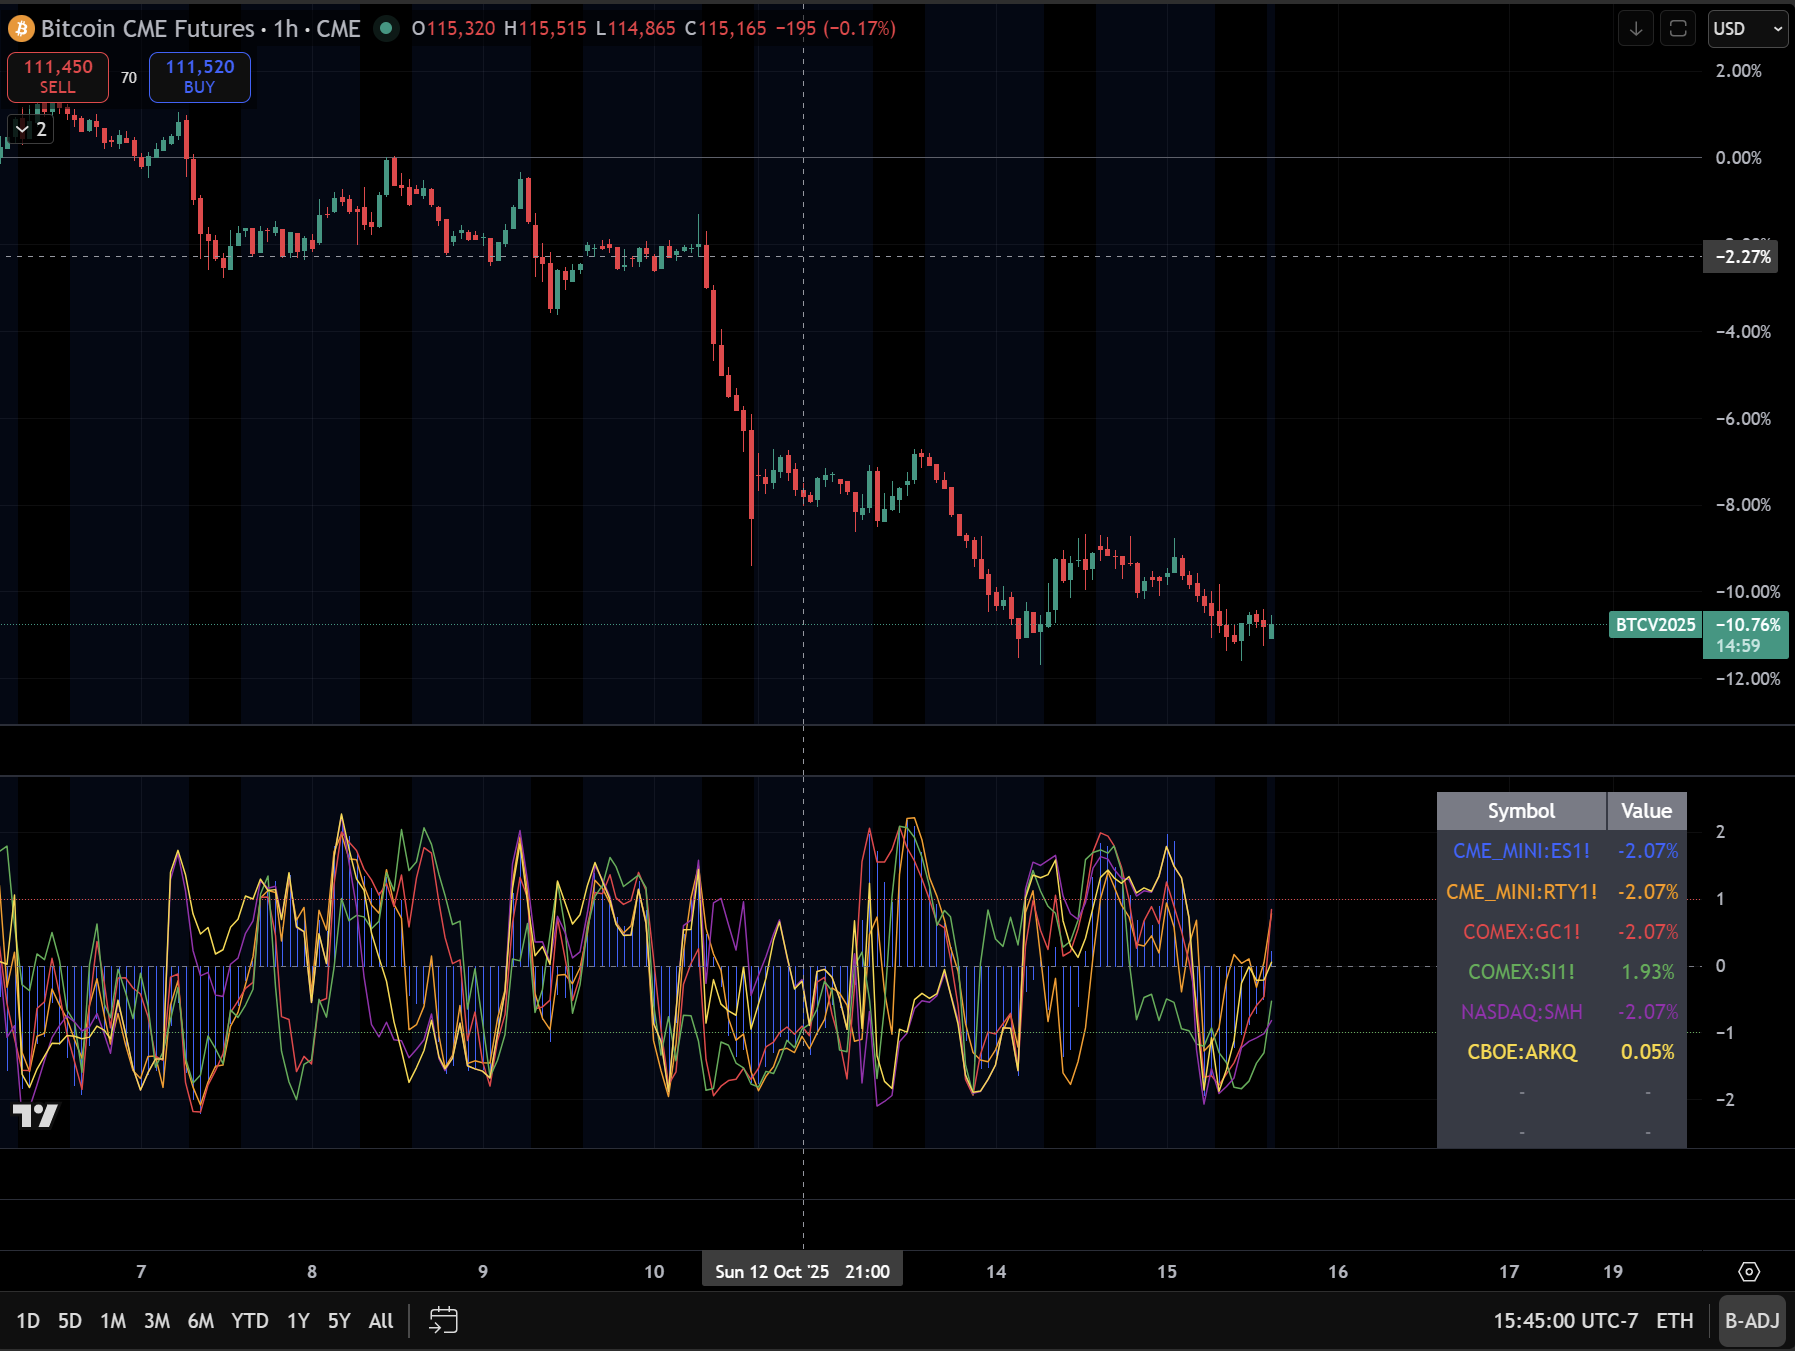
Simply based on the macro regime and how much liquidity we see in the system, I am looking for longs, but the positioning risk in Bitcoin is still clear in its underperformance and some other proprietary models I am running. I believe we will remain above these 107k levels but I think trading through FOMC will be a clearer test for a potential move to outperformance in Bitcoin. For now, I am watching the hourly timeframe for the signals I noted above.
The Looming Macro Risks:
I want to end by reminding everyone that macro risks are building in the underlying system. The largest risk to the system is from cross-border flows, and I laid out the signals and logic in this report below:

The implication is that we don’t know WHEN the amount of liquidity we have in the system will become unsustainable. We have support in equities into FOMC in my view in the absense of tariffs, but the situation is incredibly fluid.
I will keep paid subscribers updated on how my strategies and models are mapping these flows.
Thanks
As always, a Pepe for the culture:

The information on this website/Substack is for information purposes only. It is believed to be reliable, but Capital Flows does not warrant its completeness or accuracy. The information on the website/Substack is not intended as an offer or solicitation for the purchase of stock or any financial instrument. The information and materials contained in these pages and the terms, conditions and descriptions that appear, are subject to change without notice. Unauthorized use of Capital Flows websites and systems including but not limited to data scraping, unauthorized entry into Capital Flows systems, misuse of passwords, or misuse of any information posted on a site is strictly prohibited. Your eligibility for particular services is subject to final determination by Capital Flows and/or its affiliates. Investment services are not bank deposits or insured by the FDIC or other entity and are subject to investment risks, including possible loss of principal amount invested. Your use of any information which is proprietary to Capital Flows or a third-party information provider shall only be used on individual devices without any right to redistribute, upload, export, copy, or otherwise transfer the information to any centralized interdepartmental or shared device, directory, database or other repository nor to otherwise make it available to any other entity/person/third party, without the prior written consent of Capital Flows.
Hello, is it possible to pay your Substack with crypto ?
Thanks for the work Sr.