


Intro To Country Primers:
We will cap off this round of Country Primers with India! I am intentionally focusing on countries that have heightened significance in the decade we are moving into:
When you develop an exceptional understanding of macro and marry it to a clear understanding of a country, you are able to consistently monetize your knowledge in financial markets. Here are all of the educational articles:
Research Synthesis / Direction Of Capital Flows Substack

Hello everyone, There has never been a time in history when understanding the world from a global perspective and interpreting it accurately paid such a high premium. Since the very beginning of this Substack, I have talked about the nature of the time we live in and how to act intentionally in it.
In the information age, you simply need to be at the right place, at the right time, with the right information to succeed
Why should you care about India? The country of India has exceptional asymmetrical upside over the next decade because of its geopolitical position and because it is modernizing incredibly fast.

India is beginning to access technology at the same pace and in the same way the United States did two decades ago:

There has been a long-term upward trend in USDINR but the question is, will that structural changes in India begin to reverse this trend?

On top of this, many geopolitical traders who are incredibly bearish in China want to bet on a Yuan devaluation and Chinese collapse. The problem with this is that betting on a collapse in China is incredibly difficult because there are so many levers Xi can pull to keep things together. The thing about India is that if China collapses, India’s manufacturing base will benefit tremendously. If you want to bet on a collapse in China, you don’t get short the Yuan or the Chinese stock market, you get long India and Mexico (see Mexico Primer: link)!

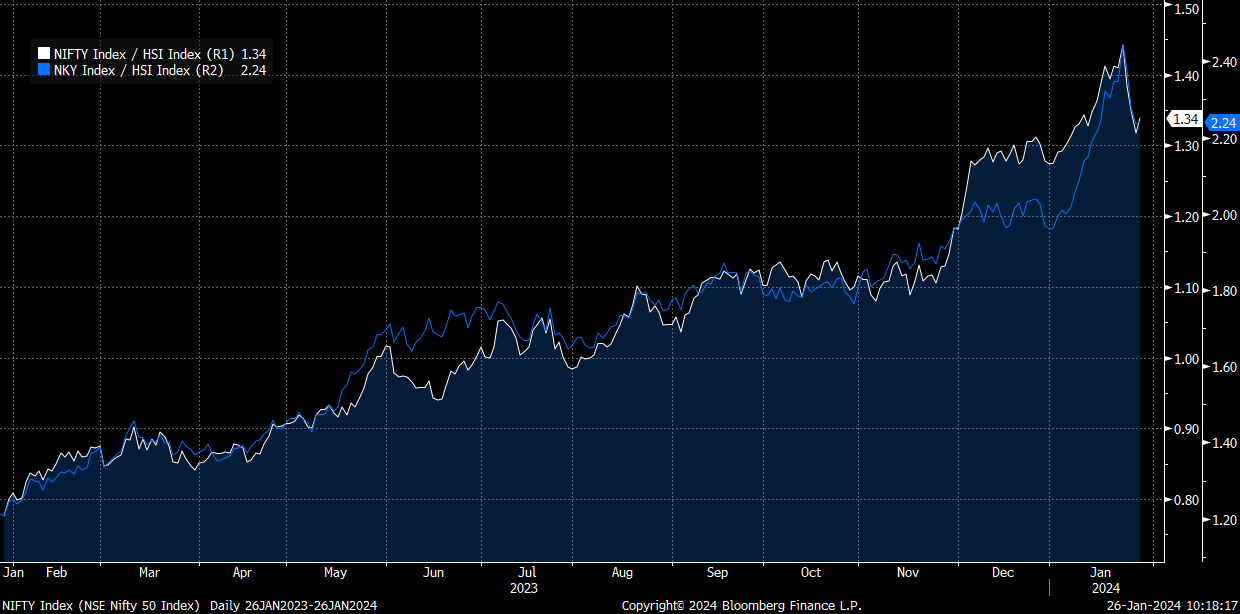
It is already clear that some traders have on a short China and long India trade on because the most recent news out of China caused the Hang Seng to rally which caused Indian stocks (along with the Nikkei) to sell off. Traders likely have on a pair trade where they have to unwind both sides.

Notice the long NIFTY / Short HSI and long Nikkei / Short HSI ratios. Weston Nakamura brought attention to this in his recent articles. I would encourage everyone to follow his work!
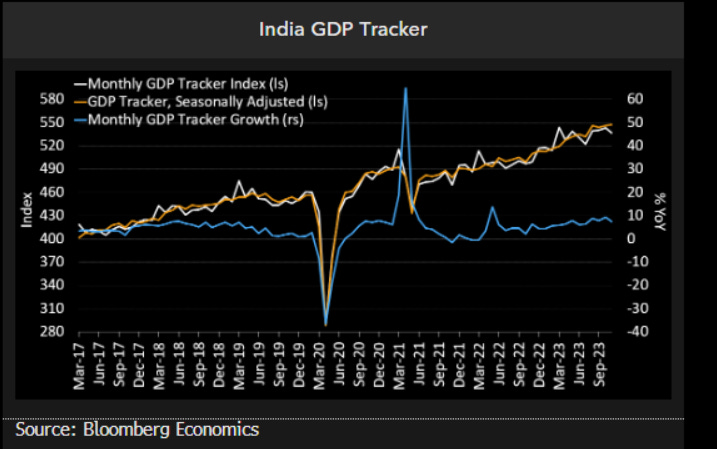
Right now the manufacturing sector is having the largest YoY acceleration contributing to GDP:

This is well-above trend and likely indicates an underlying shift connected to the new deglobalized world we are moving into:

When you connect these structural changes to cyclical views then you exponentially increase your asymmetry for trades. These primers are meant to function as a foundation for generating alpha. Keep a close eye on the SpearPoint Equity Alpha publications I am part of because we will be pitching single-name equities from India. This is how you produce uncorrelated alpha!

Overview: Here is the structure for this primer
Country Overview
Geography and Demographics
Economic Data: GDP, GNI, BoP, and Balance Sheets
Financial Markets: Stocks, Bonds, and the Indian Rupee
History of growth, inflation, and liquidity on a structural and cyclical basis
Current growth, inflation, and liquidity regime and its connection to each financial asset
Additional resources for research and trading in Indian markets
Country Overview:
Background
The Indus Valley civilization, one of the world's oldest, flourished during the 3rd and 2nd millennia B.C. and extended into northwestern India. Aryan tribes from the northwest infiltrated the Indian subcontinent about 1500 B.C.; their merger with the earlier Dravidian inhabitants created the classical Indian culture. The Maurya Empire of the 4th and 3rd centuries B.C. - which reached its zenith under ASHOKA - united much of South Asia. The Golden Age ushered in by the Gupta dynasty (4th to 6th centuries A.D.) saw a flowering of Indian science, art, and culture. Islam spread across the subcontinent over a period of 700 years. In the 10th and 11th centuries, Turks and Afghans invaded India and established the Delhi Sultanate. In the early 16th century, the Emperor BABUR established the Mughal Dynasty, which ruled India for more than three centuries. European explorers began establishing footholds in India during the 16th century.
By the 19th century, Great Britain had become the dominant political power on the subcontinent and India was seen as the "Jewel in the Crown" of the British Empire. The British Indian Army played a vital role in both World Wars. Years of nonviolent resistance to British rule, led by Mohandas GANDHI and Jawaharlal NEHRU, eventually resulted in Indian independence in 1947. Large-scale communal violence took place before and after the subcontinent partition into two separate states - India and Pakistan. The neighboring countries have fought three wars since independence, the last of which was in 1971 and resulted in East Pakistan becoming the separate nation of Bangladesh. India's nuclear weapons tests in 1998 emboldened Pakistan to conduct its own tests that same year. In November 2008, terrorists originating from Pakistan conducted a series of coordinated attacks in Mumbai, India's financial capital. India's economic growth following the launch of economic reforms in 1991, a massive youthful population, and a strategic geographic location have contributed to India's emergence as a regional and global power. However, India still faces pressing problems such as environmental degradation, extensive poverty, and widespread corruption, and its restrictive business climate challenges economic growth expectations.

Geography and Demographics:
India is in a very unique place from a geopolitical perspective.
First, its geography places it directly between 3 major entities: The Middle East, the Indian Ocean, and China. You basically have either mountains, deserts, or the ocean on any side of India. This creates a “geographic box” that makes it hard for India to break out of from an economic or militaristic perspective. This also means it is hard for other people to break into India (link).
Second, India has excellent agricultural wealth and natural resources.
Natural resources
coal (fourth-largest reserves in the world), antimony, iron ore, lead, manganese, mica, bauxite, rare earth elements, titanium ore, chromite, natural gas, diamonds, petroleum, limestone, arable land
Land use
agricultural land: 60.5% (2018 est.)
arable land: 52.8% (2018 est.)
permanent crops: 4.2% (2018 est.)
permanent pasture: 3.5% (2018 est.)
forest: 23.1% (2018 est.)
other: 16.4% (2018 est.)
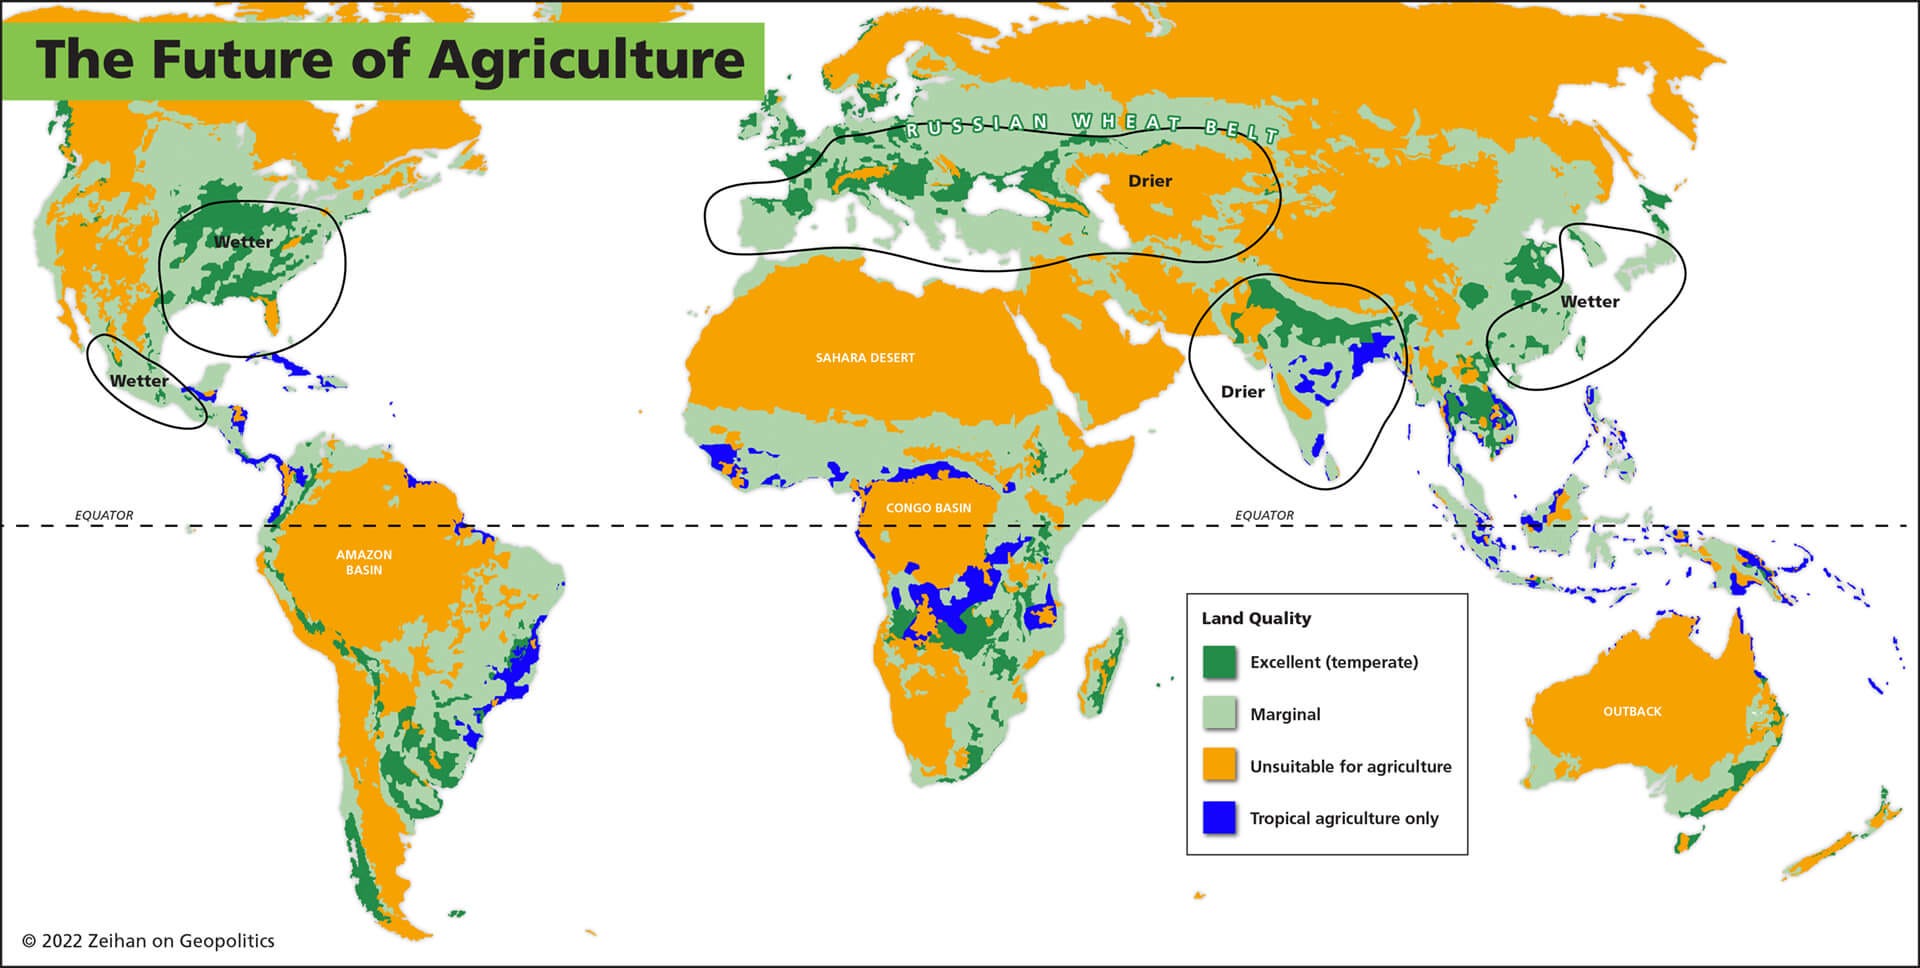
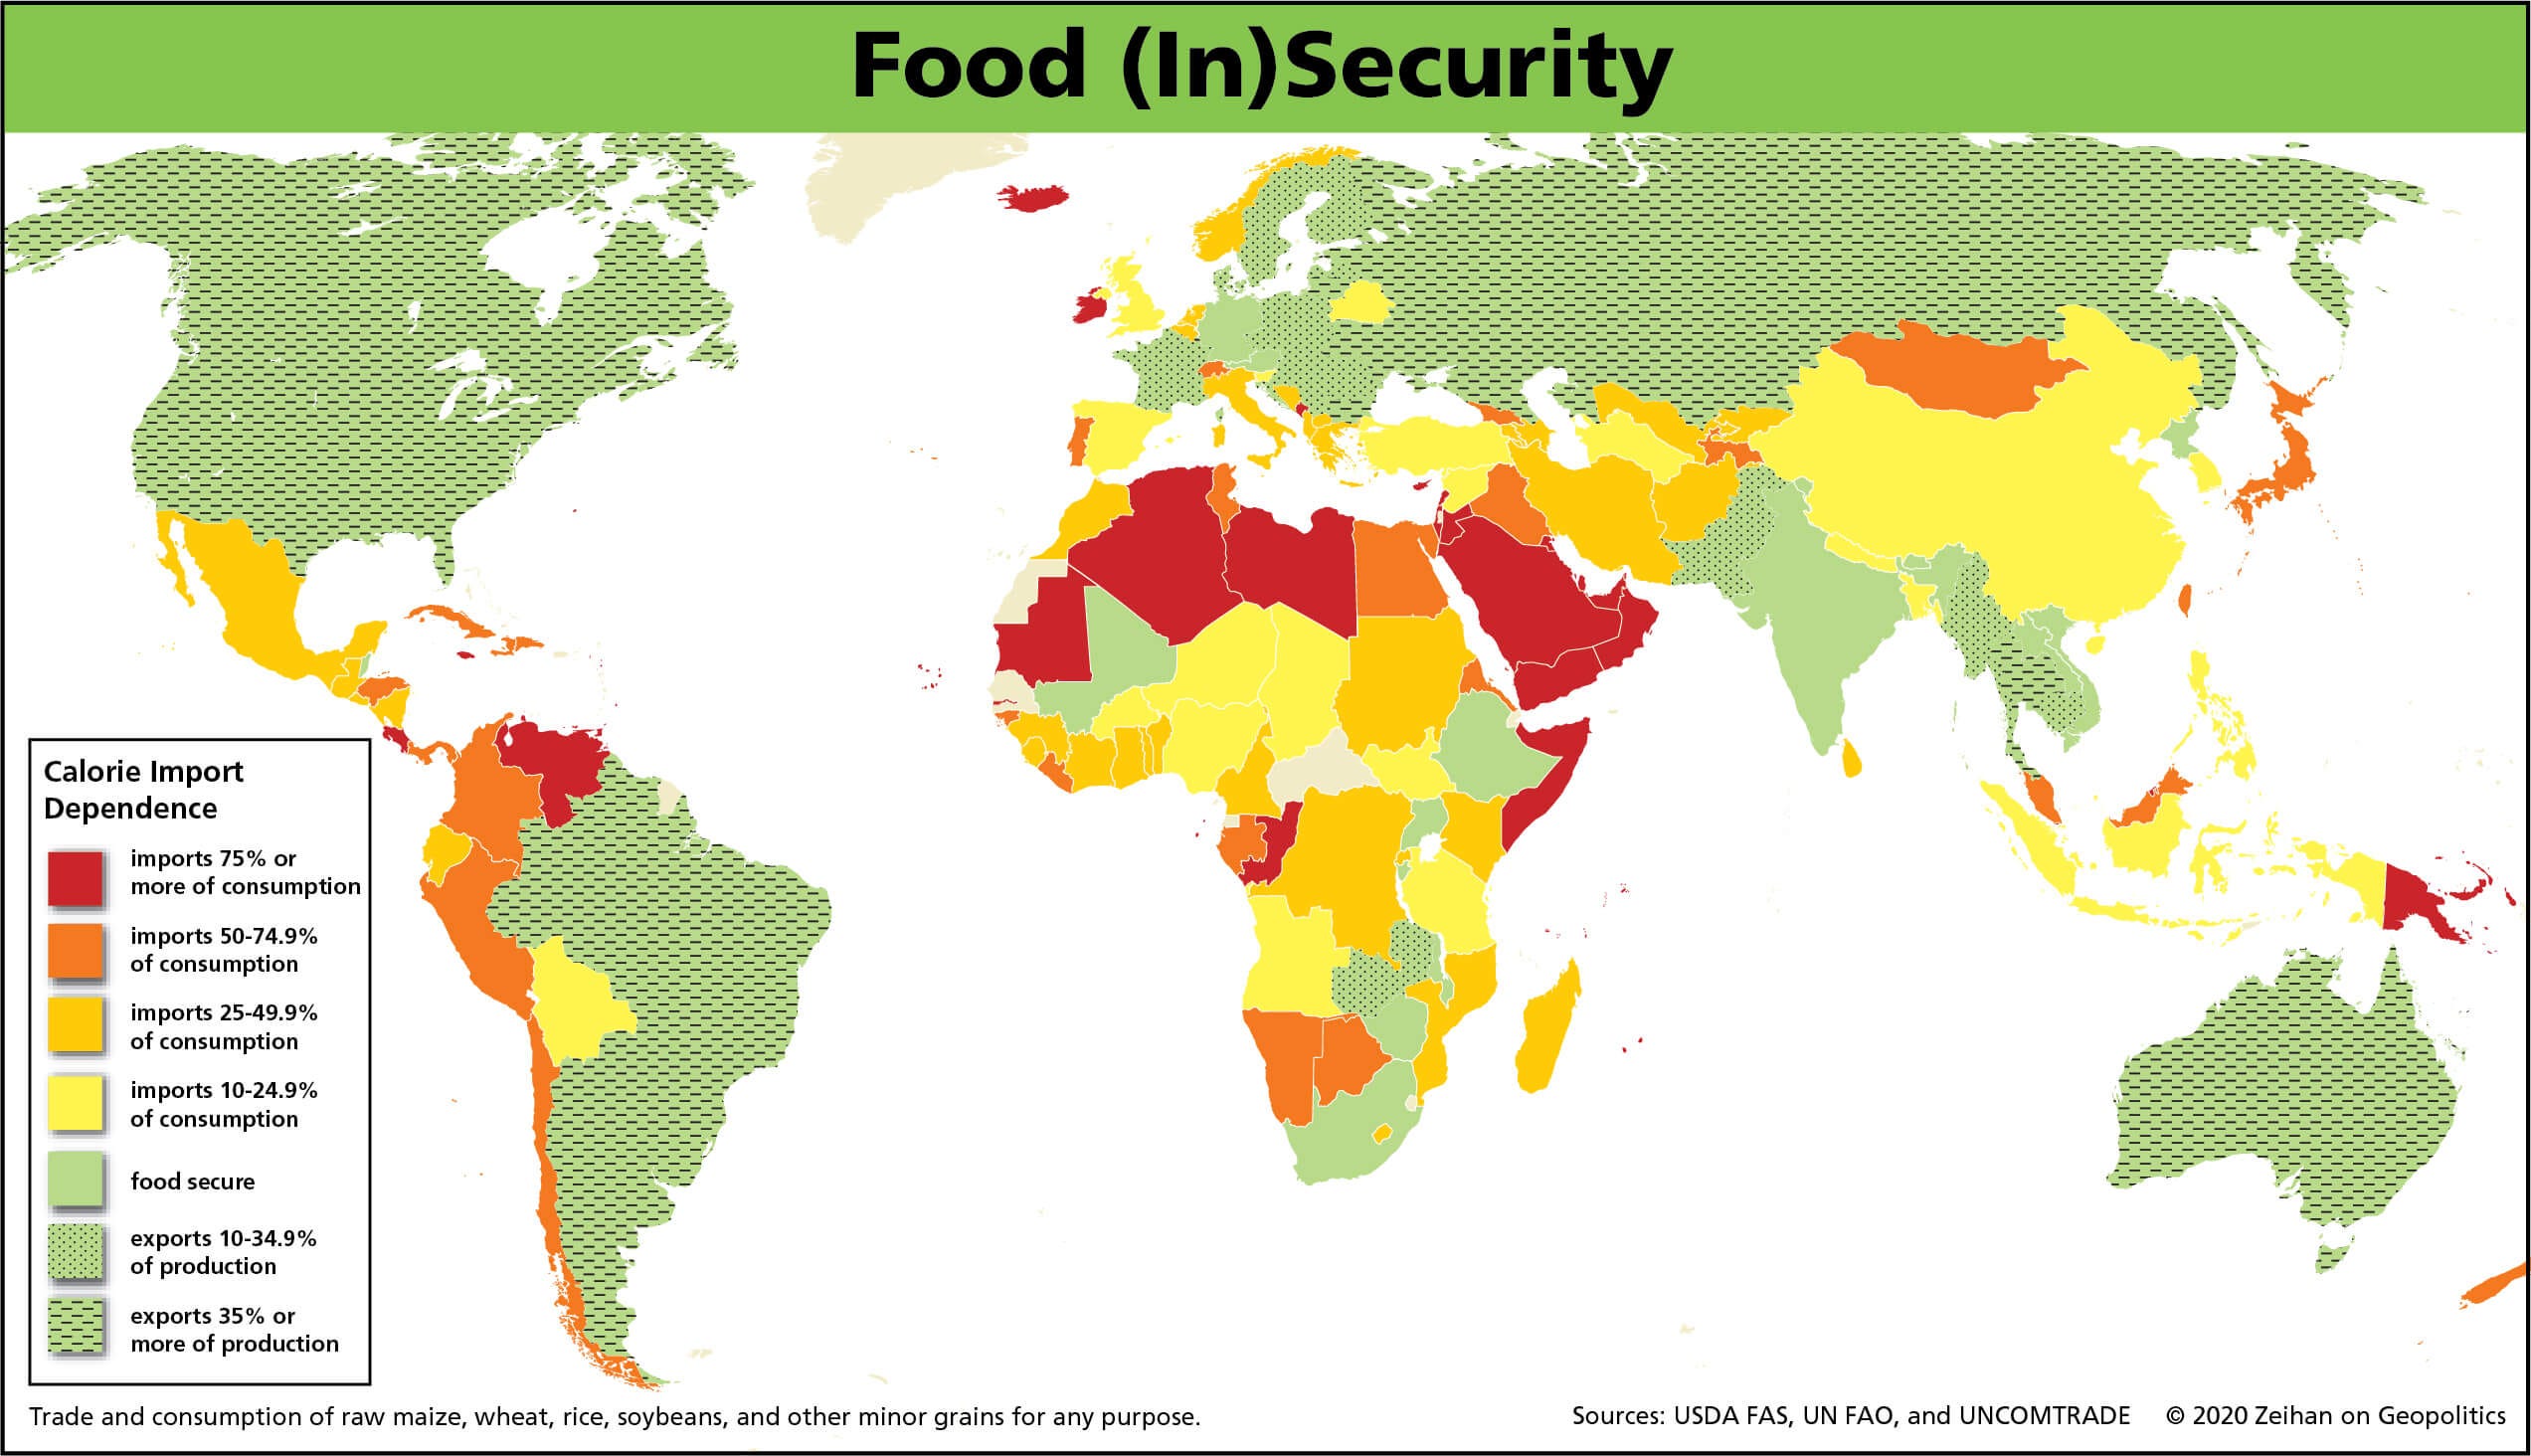
This means that if there are transportation issues or geopolitical risks, India is unlikely to have a complete collapse due to famine (a scenario very possible for China due to their situation).
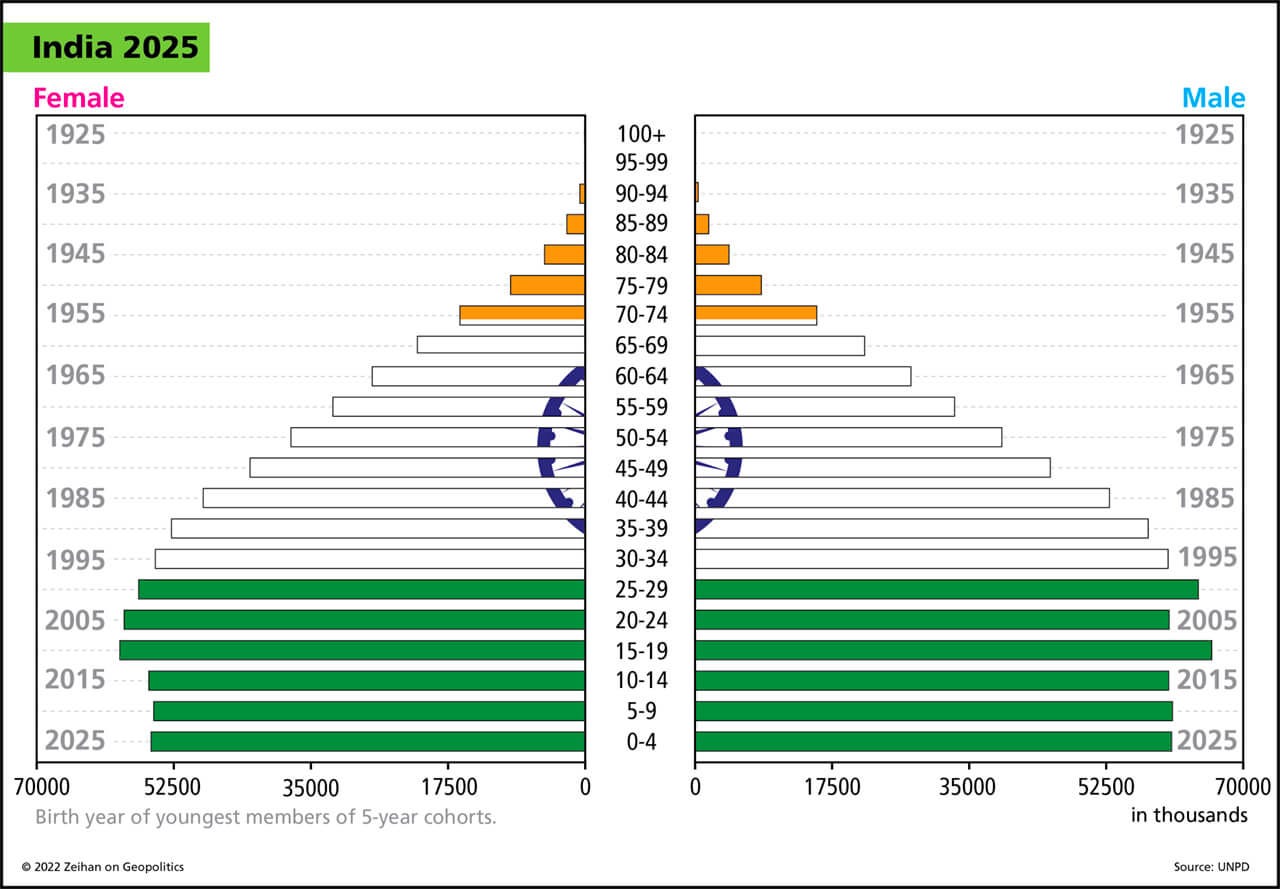
Third, India is at an amazing place in terms of their demographics. They also have a lot of skilled labor which can dramatically change the TYPE of exports other countries source from India.
In a world of deglobalization, supply chain issues, scarcity, and geopolitical tension, India is unlikely to collapse. Furthermore, their country continues to modernize exponentially which will bring higher and HIGHER amounts of productivity.
The specific products and their destination in the current account will be important to monitor moving forward as geopolitical volatility occurs. Connecting these variables to economic data and financial markets is how we can generate trade ideas.

It is these bigger-picture issues that set the context for the economic data in India.
Economic Data: GDP, GNI, BoP, and Balance Sheets
Now that we have the big-picture context for India, we need to quantify each moving part of the economy with data. When we approach economic data, we want to quantify the FLOW and CAPITAL STRUCTURE for each agent (households, corporates, sovereigns, financial institutions). If you want a good book on this, check out The Volatility Machine.
Big picture, India's nominal (white) and real (blue) GDP have been incredibly elevated over the past decade excluding 2020.

Private consumption is the largest line item of GDP with fixed capital formation coming in second. This is a key observation!

When you have fixed capital formation as a large and growing attribution of GDP, that is a signal about the durability of underlying growth. Notice that fixed capital formation as a % of GDP (in blue) is accelerating significantly. This is occurring while government spending as a % of GDP (orange) remains low. Private consumption (white) remains a durable attribution.

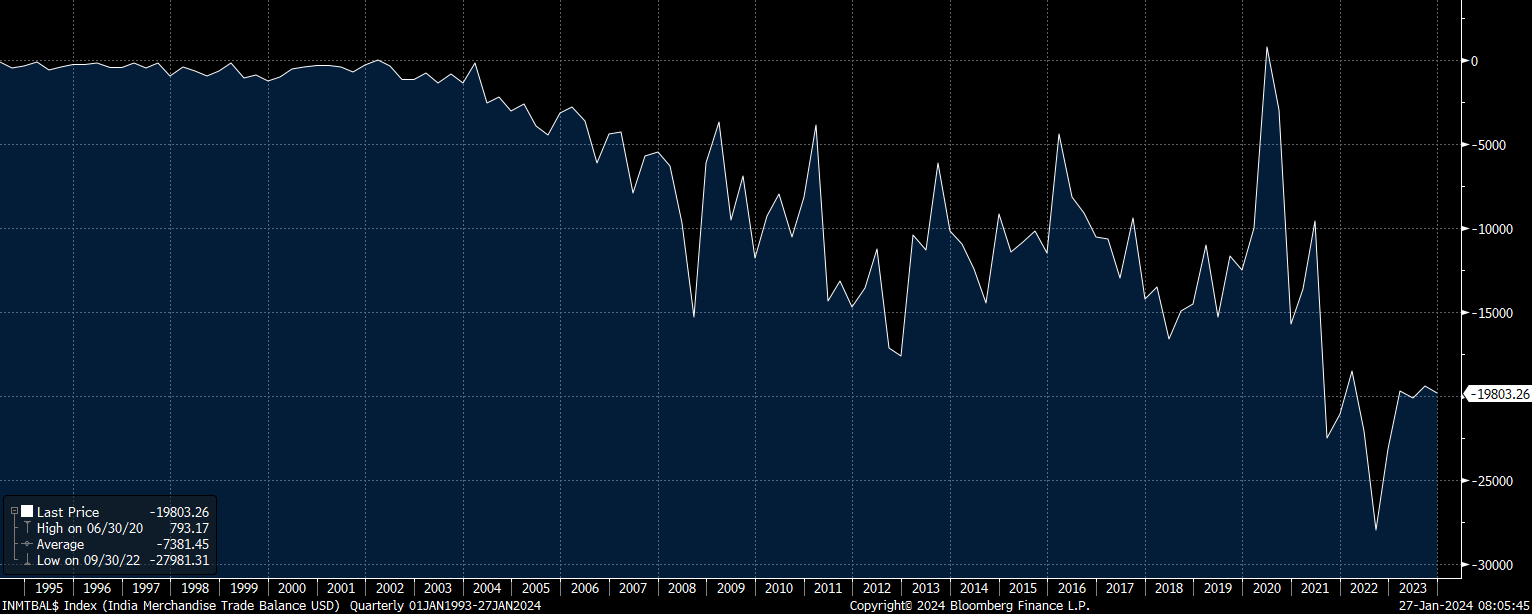
Fundamentally, India is investing in its economy to increase output. Right now, they are running a trade balance deficit which means they are importing more than they are exporting. A negative trade balance is a reflection of high demand relative to the amount of output:
All of these economic and capital flows directly connect to the geopolitical situation:


These flows are directly reflected in the earnings and valuation differentials between India and China. (I will touch on this more later)

Back to the economic data side, India's GDP by sector is directly connected with the insights from the geopolitical section above. Notice that manufacturing and finance are the largest line items:

Total loans and assets of the largest bank by market cap are accelerating considerably:


One of the largest companies in the manufacturing sector is showing considerable growth as well:

Their stock price has been making huge gains:

Revenues and earnings are accelerating as well:

Watching the specific fundamentals of companies like this in connection with foreign investment flows and the trade balance will be key because all of these various data points reflect the same underlying system.
Within this manufacturing theme, industrial production continues to run at an elevated level:

Given the amount of structural changes, geopolitical volatility, and the country’s placement in global value chains, India’s inflation doesn’t have a high correlation with US inflation rates:

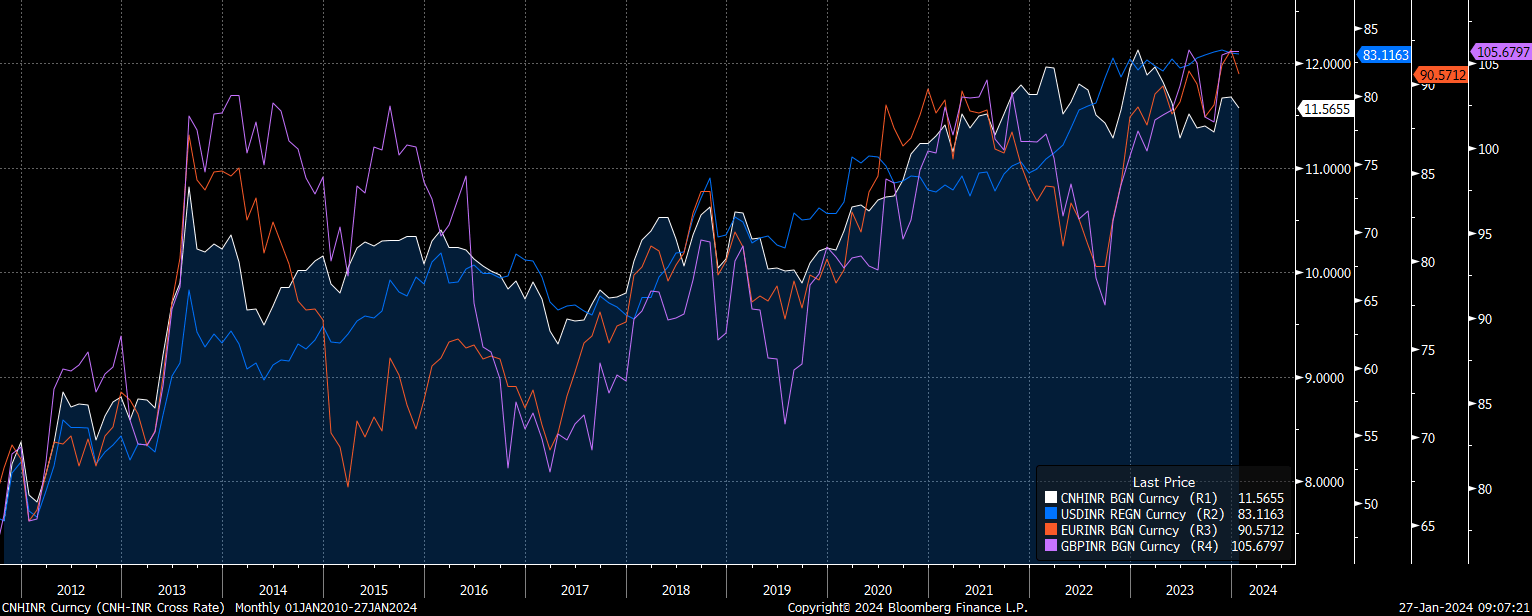
Monitoring the growth and inflation differentials between India and G7 countries will be key for quantifying FX moves. As I noted above, the Rupee has been in a prolonged downtrend against major currencies. However, if India begins to attract significant amounts of foreign capital, turn their trade balance into a surplus, and maintain its current growth rates, there is a high probability we could see this trend shift on a structural basis. See the FX primer for more on this. Also, one of the best FX books I have ever read is Foreign Exchange: Practical Asset Pricing and Macroeconomic Theory. I recommend it to everyone!
The Research HUB: FX Primer, Pt 5

Hey everyone, This is Part 5 of the FX Primer! 5-Part FX Primer Breakdown: Part 1: FX - Resources, The Big Picture, Variables, Aggregating Knowledge, and Essential Tools. Part 2: FX - Synthesizing Information from Part 1: Theory, Practice, Causal Mechanics vs. Regression Analysis.
The Yuan is already falling against the Rupee and if cyclical differentials begin to align, they could be the precursor for a larger structural change:
The final dynamic to take note of is credit.
Government debt to GDP accelerated during COVID:
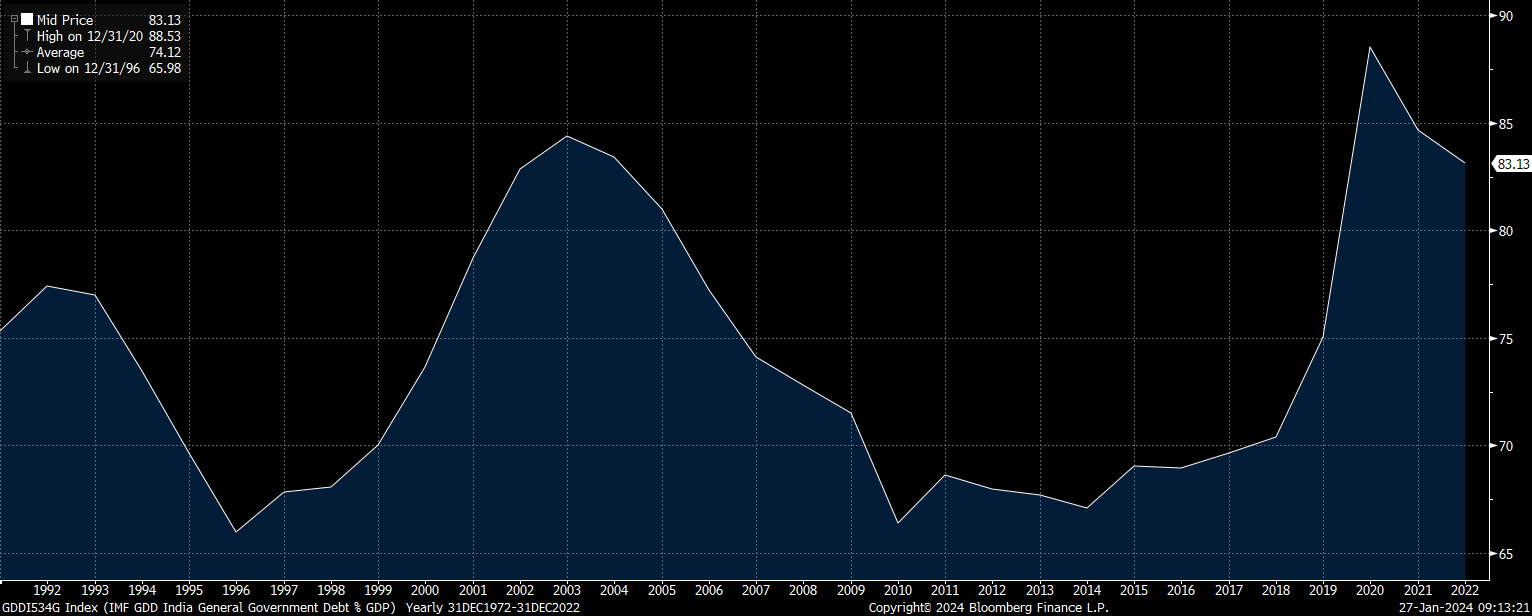
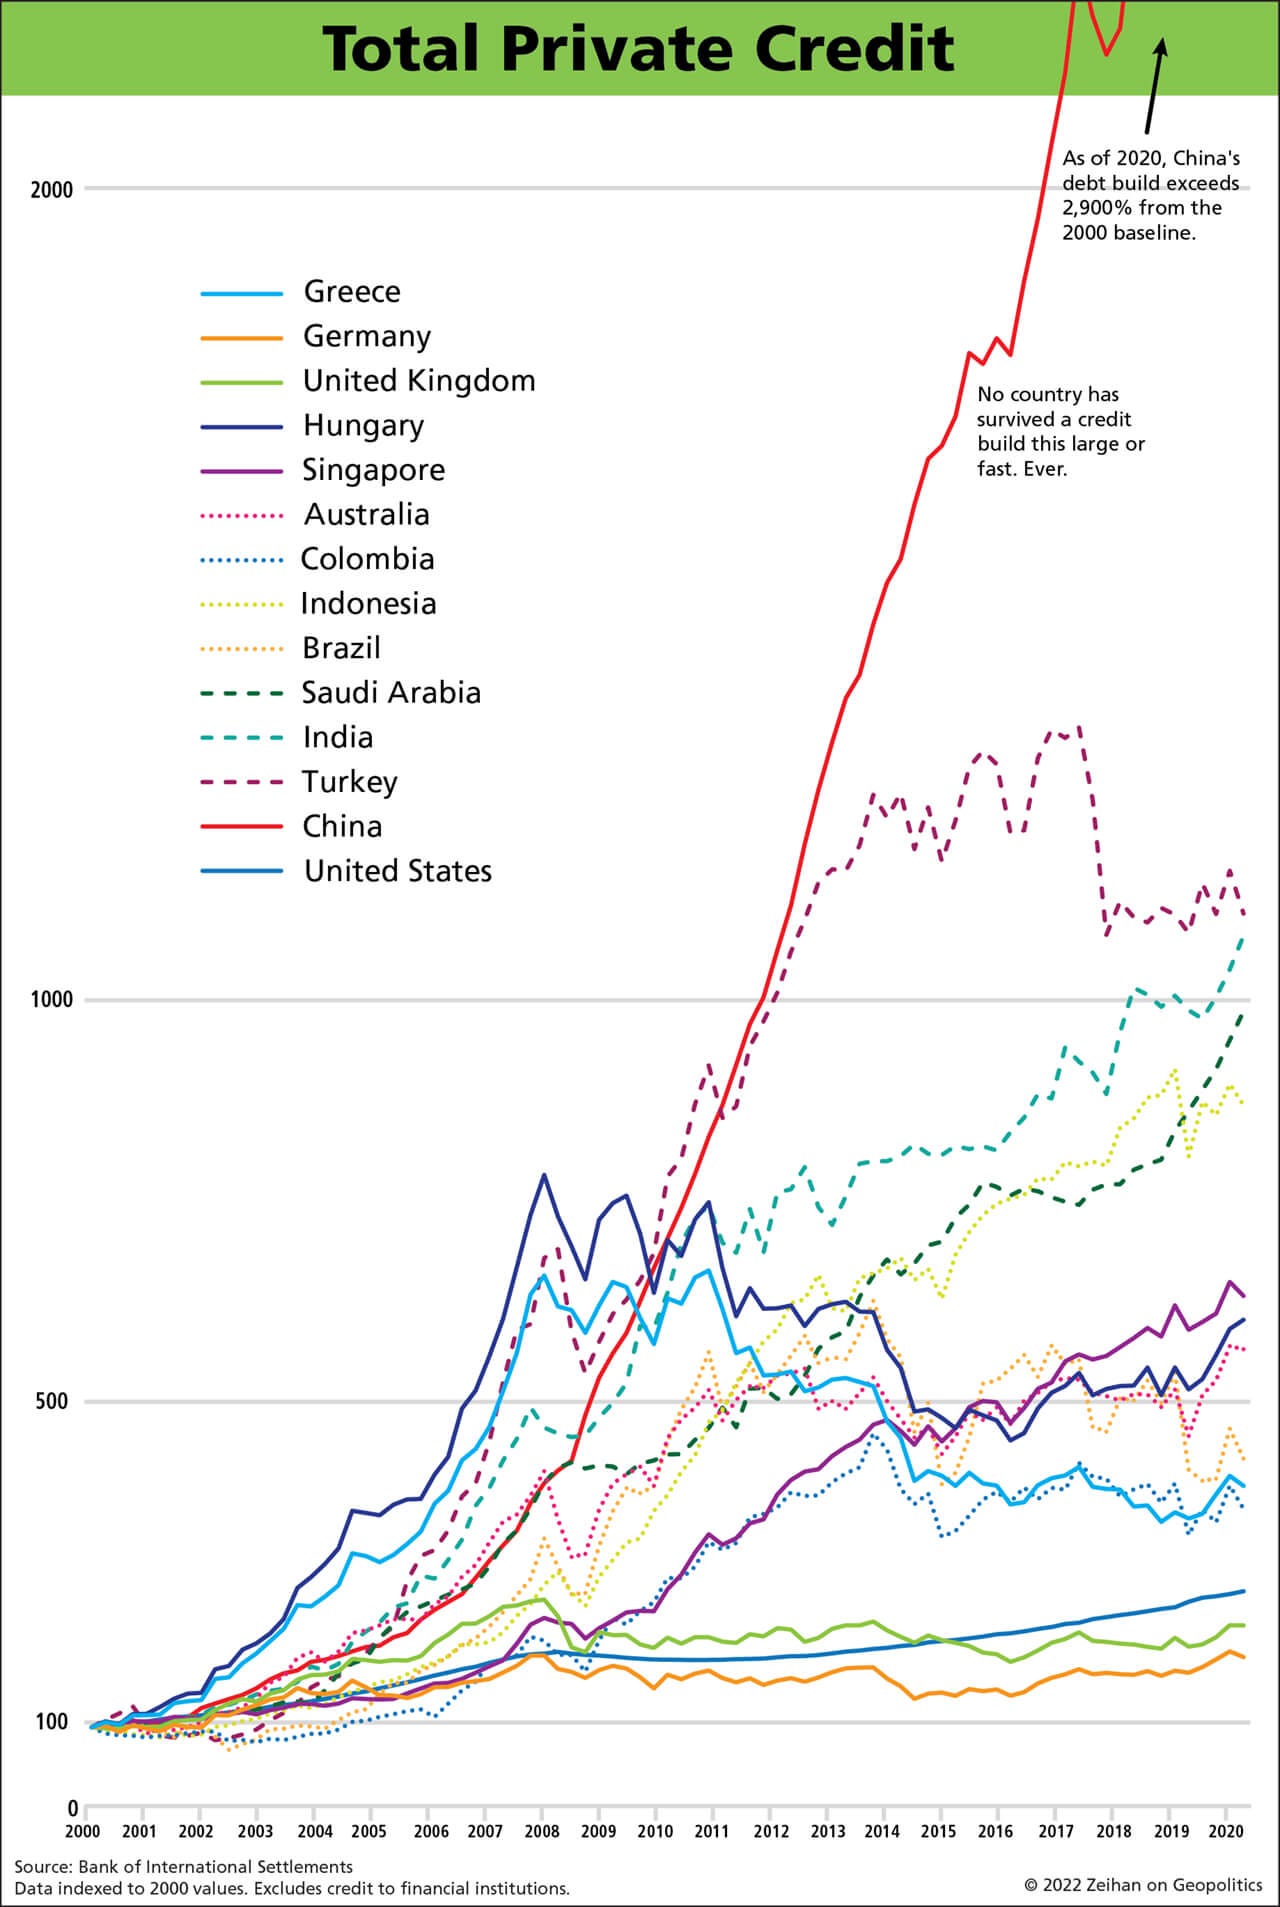
When we zoom out though, India remains much lower than China and has the underlying growth to support it:
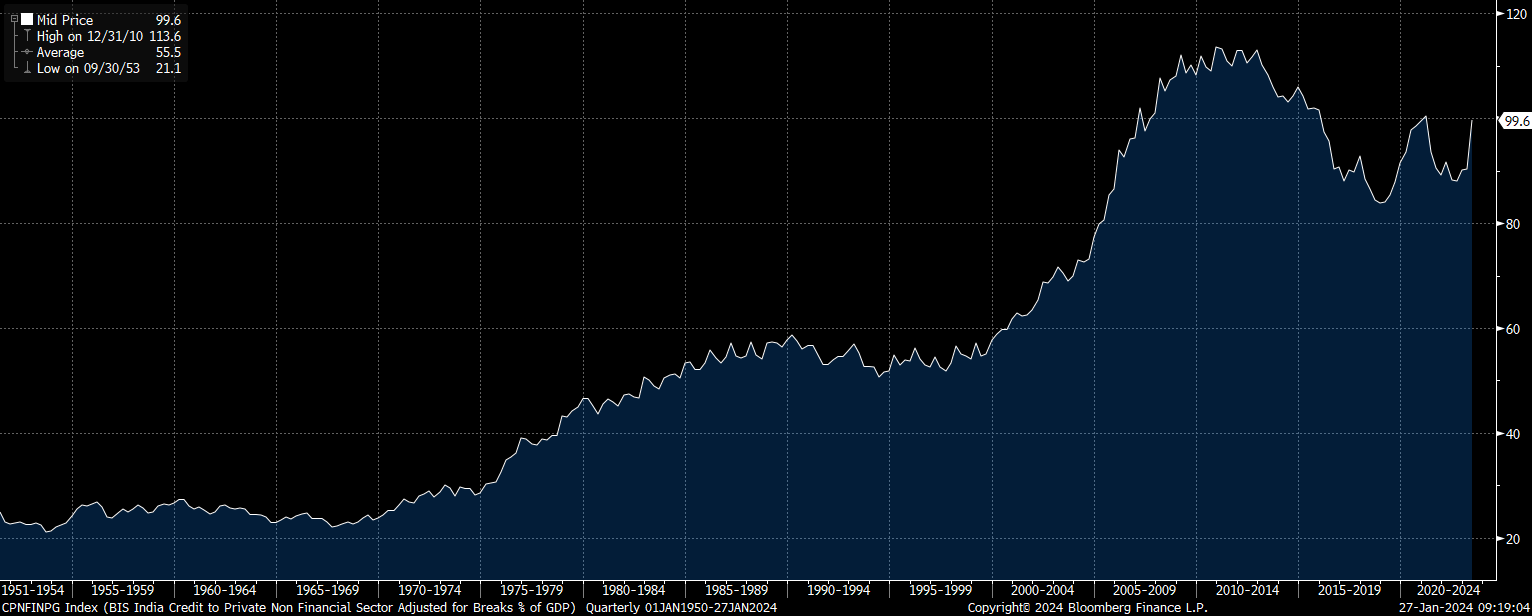
Overall credit to GDP remains below all-time highs and the continued structural changes are likely to fuel credit creation:
Household credit to GDP = white
Non-financial corporations credit to GDP = blue
Government debt to GDP = orange
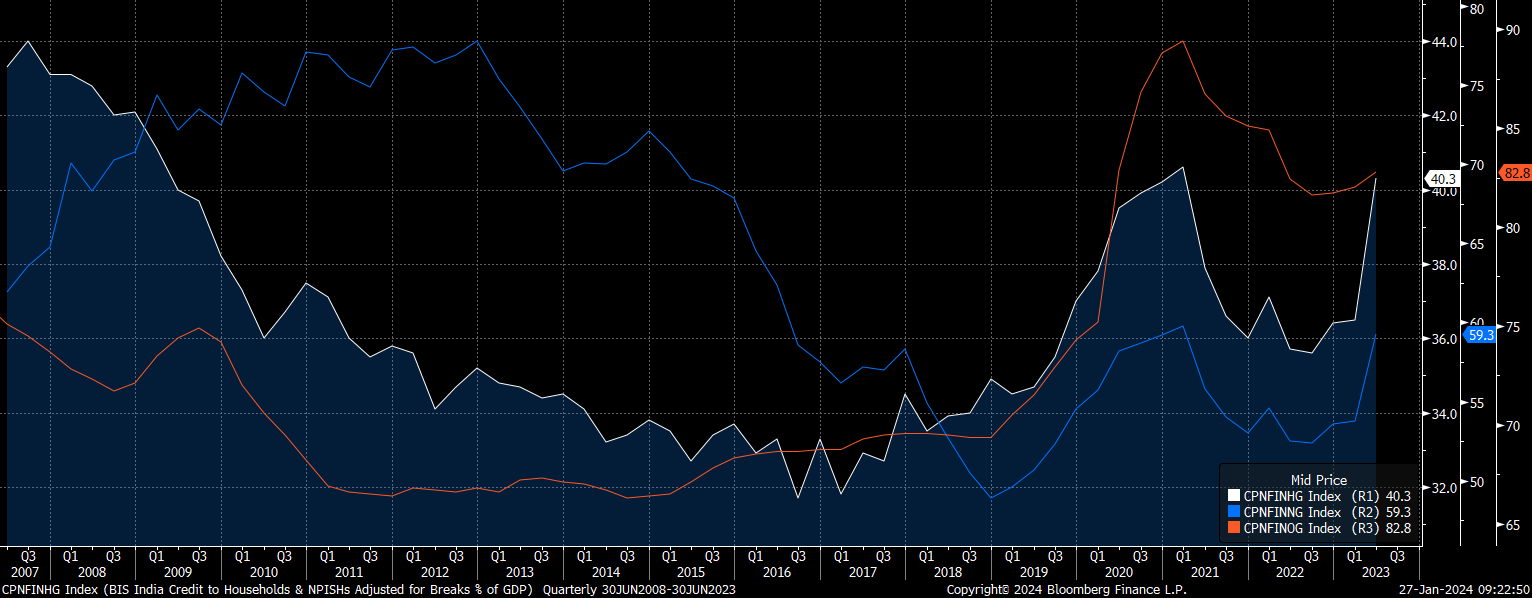
While the government has the largest credit-to-GDP ratio, we are seeing considerable accelerations in the amount of household and corporate credit. This is exactly what you want to see in confluence with strong growth for durability in a bullish trend for assets.
Now that we have painted the big picture and connected it to economic data, let’s move to India’s financial markets.

Financial Markets: Stocks, Bonds, and the Indian Rupee
The way you break down financial assets in India is very similar to how you break down assets in any country. However, you need to remember that every market is unique and there will always be different variables you need to account for. On a fundamental basis, the causal mechanics are the same. If you understand the causal mechanics of what drives asset markets in general (and not simply a siloed experience from the US), you will pick it up very fast.
There is one main idea that you will begin to see: Global markets are ALL connected. The same people who trade US assets also trade Indian assets. The PM managing risk in the Magnificent 7 stocks could be an Indian hedge fund manager balancing risk in their corporate bond book that is denominated in the Rupee. Just because you might trade assets in a silo doesn’t mean that is how the world works.
Equities:
There are two major equity indices in India
BSE SENSEX (S&P Bombay Stock Exchange Sensitive Index): Often referred to as the SENSEX, this index is one of the oldest and most widely tracked stock market indices in India. It comprises 30 well-established and financially sound companies listed on the Bombay Stock Exchange (BSE). These companies are among the largest and most actively traded stocks on the BSE, representing various industrial sectors of the Indian economy.
NSE NIFTY 50 (National Stock Exchange Fifty): The NIFTY 50 is the flagship index of the National Stock Exchange of India (NSE) and is a benchmark index for Indian equity markets. It represents 50 of the largest and most liquid Indian securities traded on the NSE. Like the SENSEX, the NIFTY 50 covers major sectors of the Indian economy and offers broad market exposure through the performance of these companies.
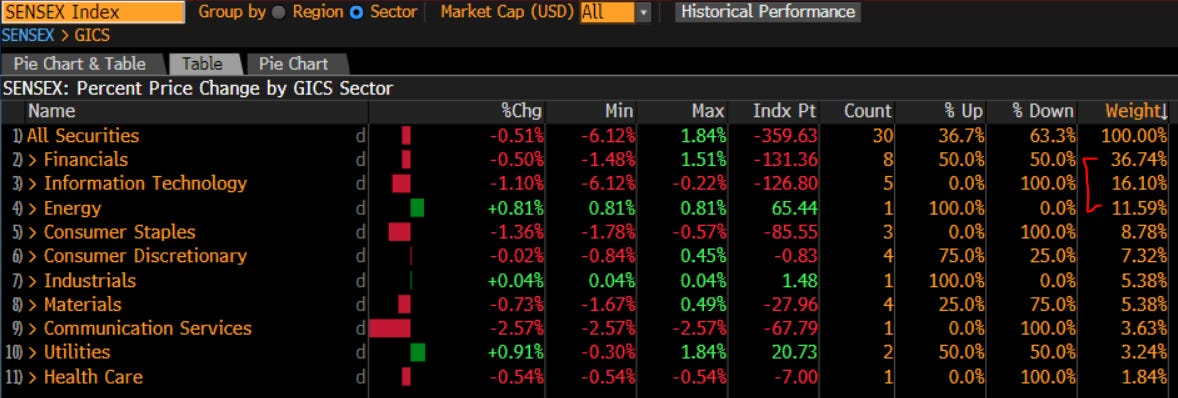
The largest sector weighting of the SENSEX are financials, tech and energy:
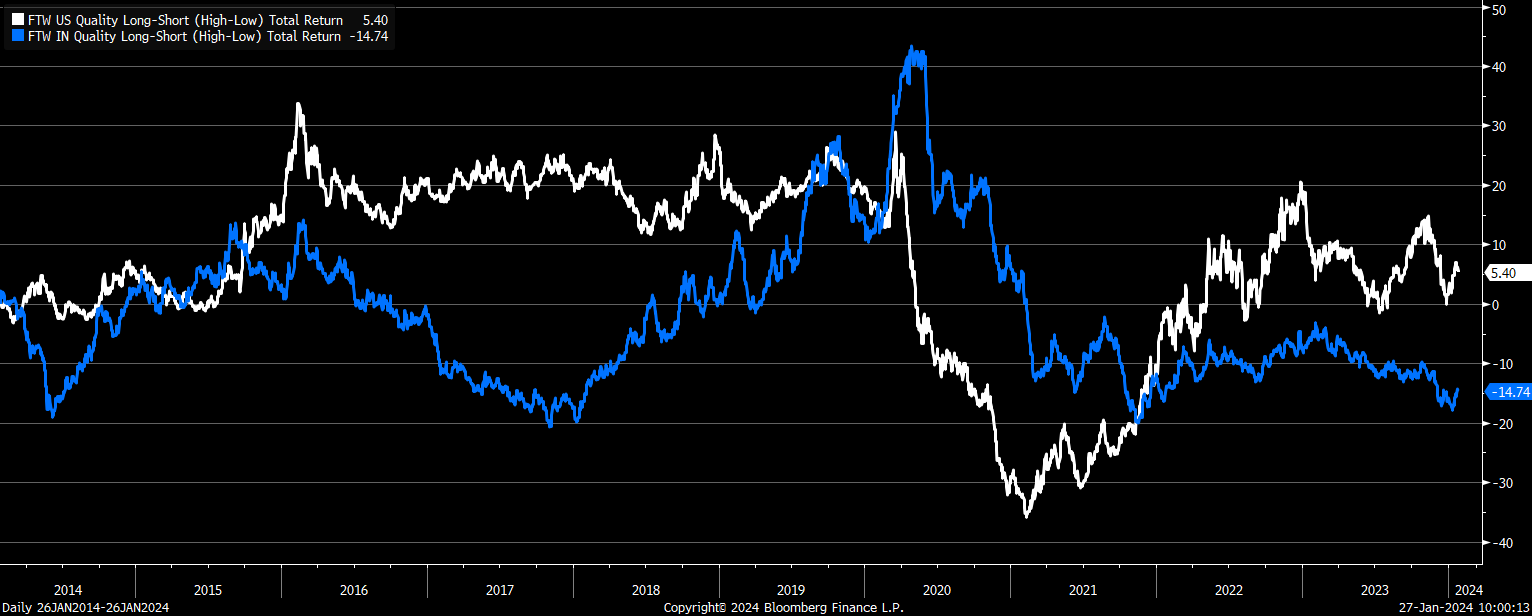
When we examine factor performance between India and the US, we can see there is a marginal correlation but still a lot of divergences that stem from divergences in growth, inflation, and liquidity: (chart is of the quality factor in India and the US)
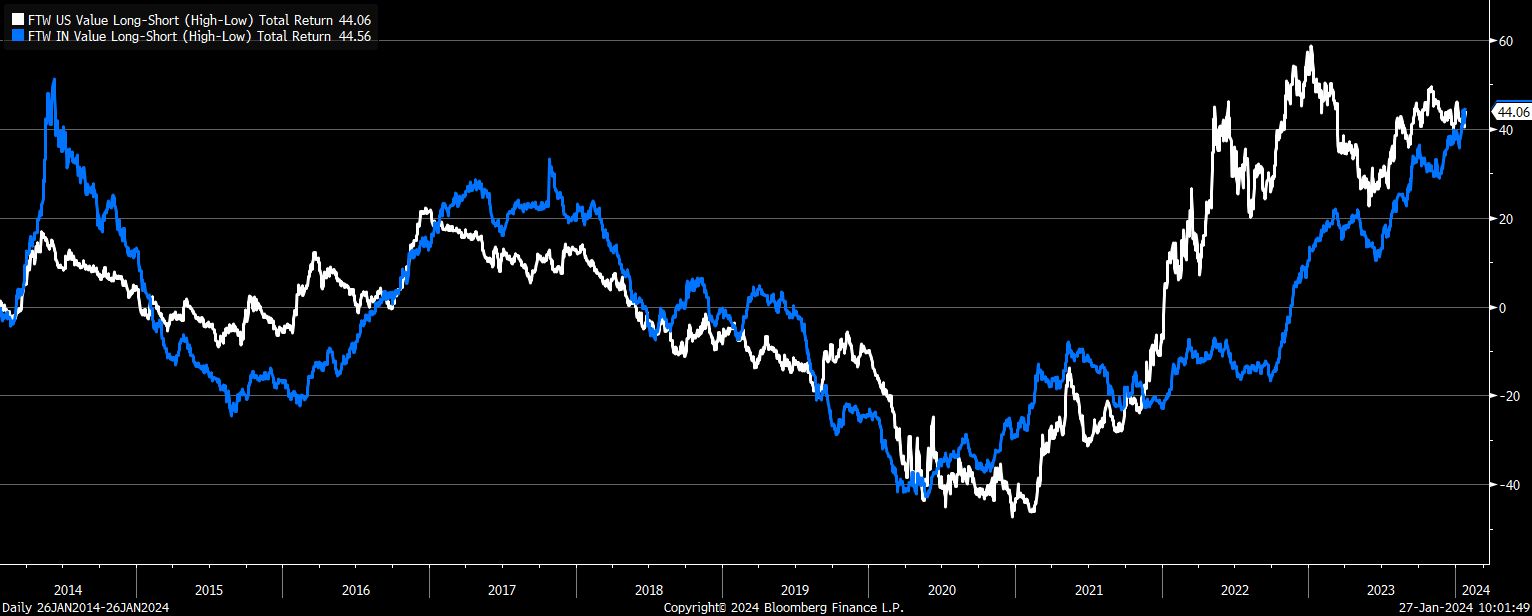
Value vs growth factor is similar.
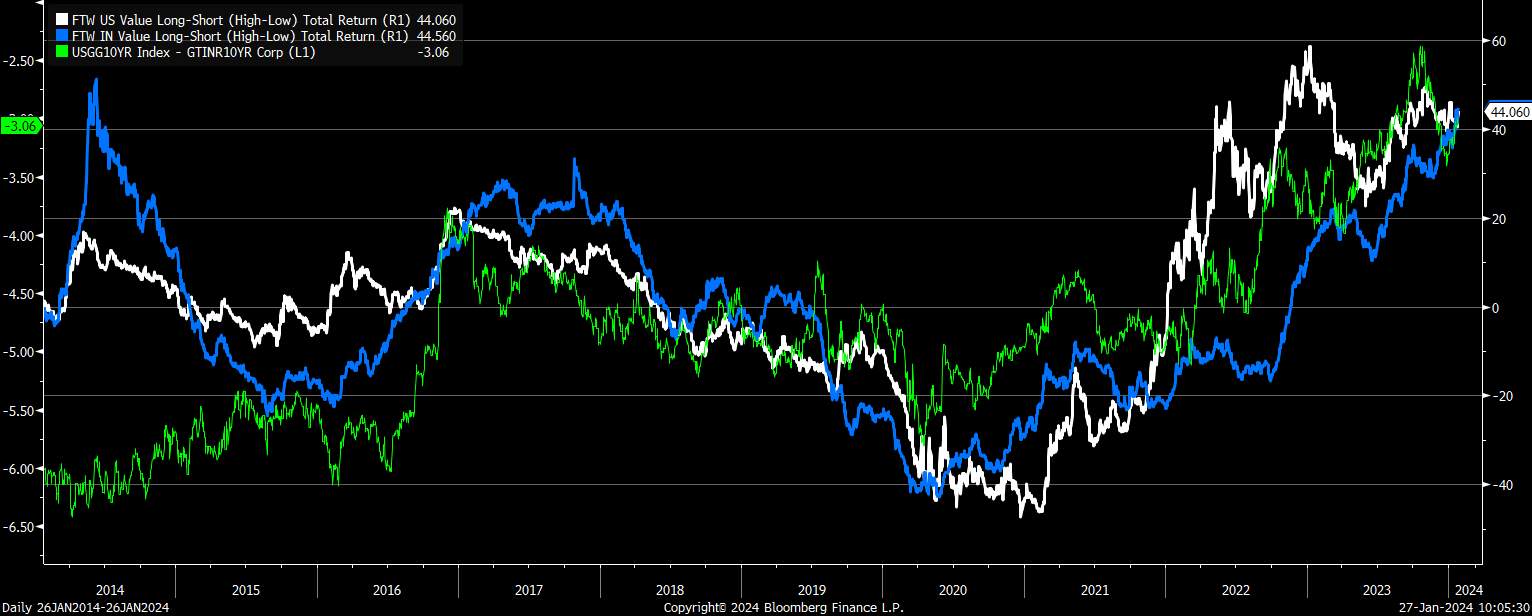
As I noted above, monitoring the growth, inflation, and policy differentials are directly connected to the factor flows. Here is the same growth vs value chart with India and US 10-year nominal rate differentials:
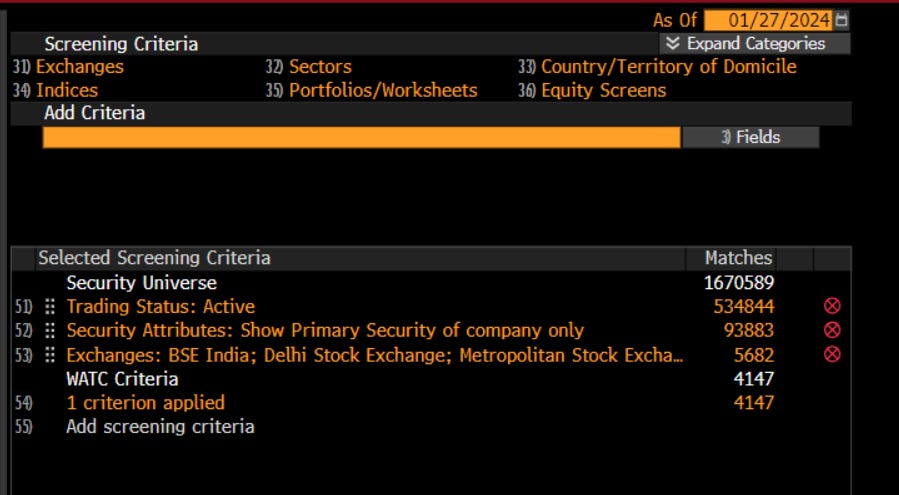
When we look at the opportunity set in India, there are over 4,000 publically traded stocks with a market cap over 100m.
In the multipolar and deglobalized world we are moving into, trade expression will take an outsized role, especially in India. There are a ton of companies that have very specific exposure to specific TYPES of volatility. As I noted above, myself and SpearPoint Management LLC will be generating alpha in this realm on the SpearPoint Equity Alpha publication.
Bonds:
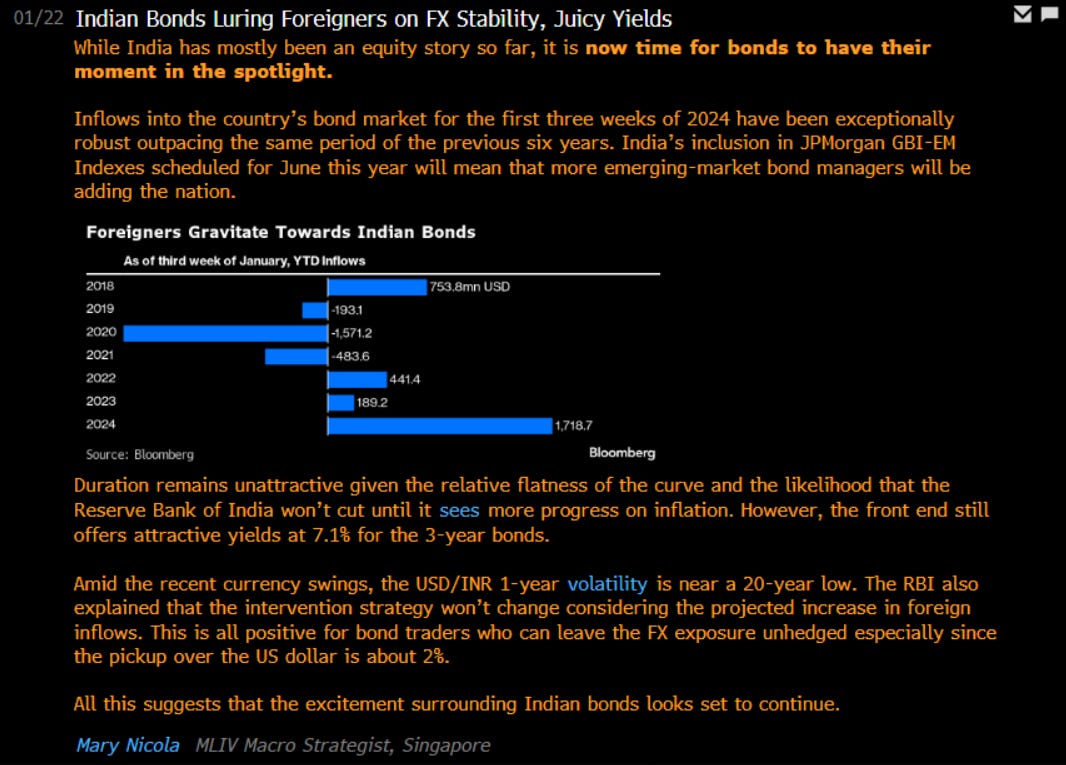
In connection with the macro flows noted above, we are seeing foreign inflows into Indian bonds:
US interest rates on the long end had an additional push higher in 2023 due to the treasury issuing additional duration. The Indian 10-year remained in its range though.
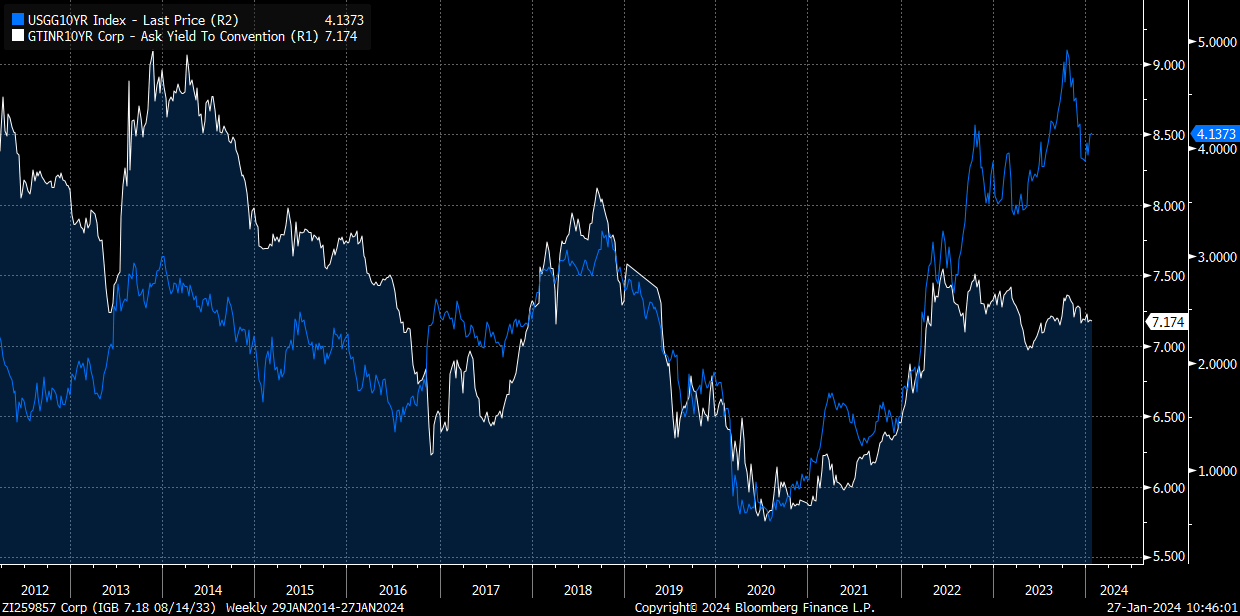
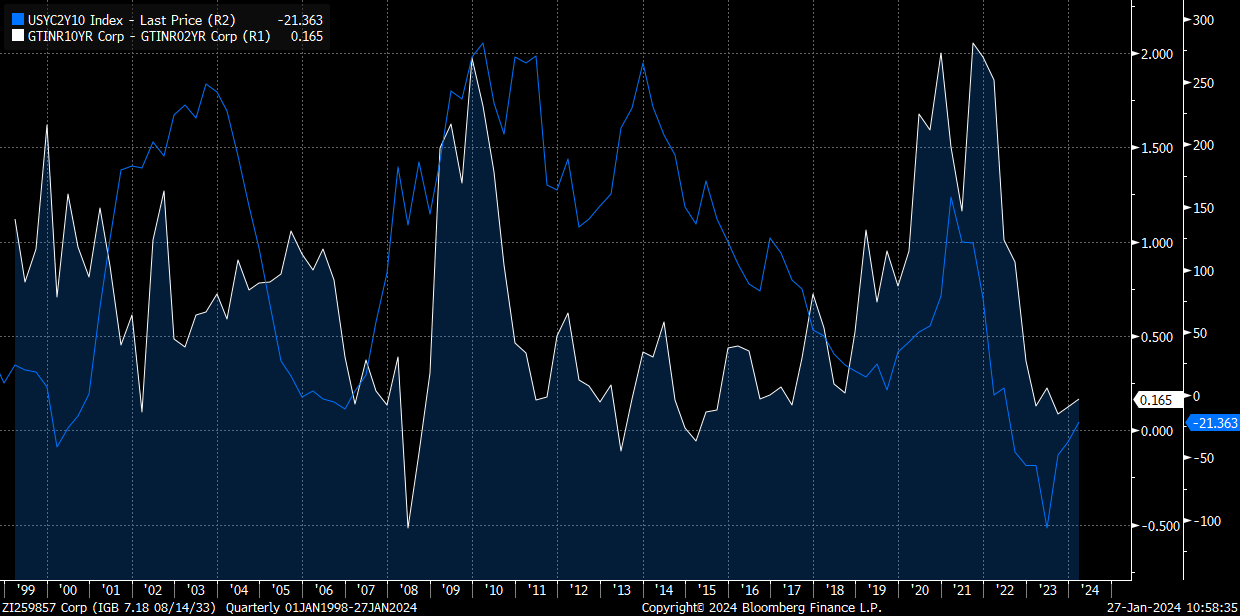
India has higher rates than the US right now on both the long end and short end:
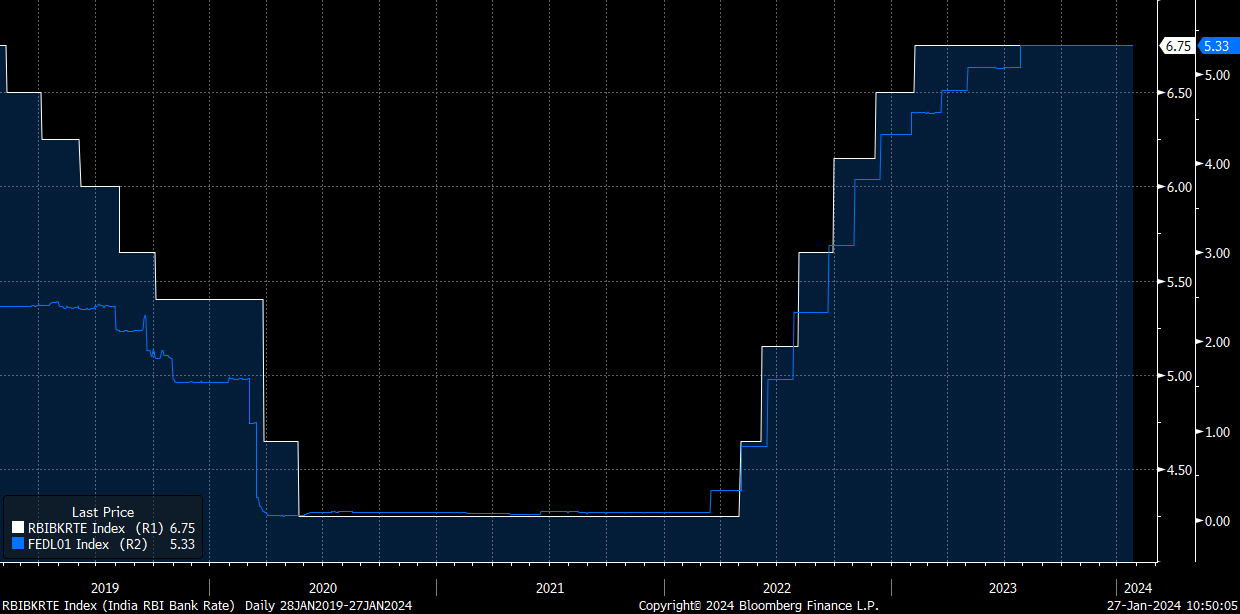
India’s yield curve is upward-sloping as their central bank is holding rates at an elevated level:
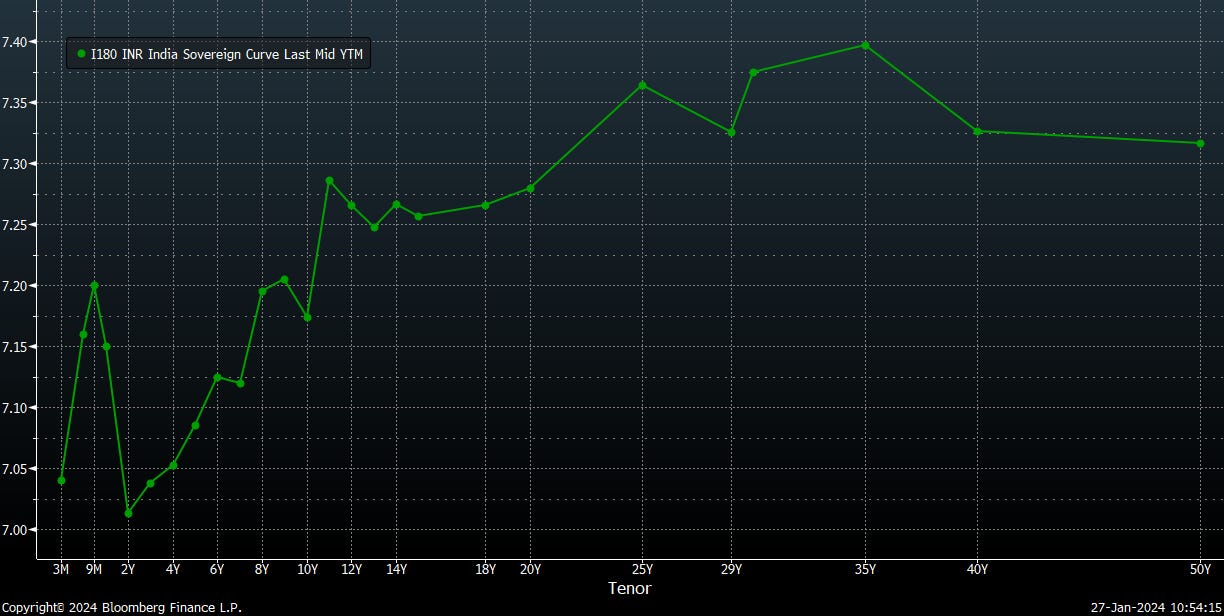
As with inflation and nominal rates, India’s yield curve has considerable divergences from major domestic yield curves. These are the types of macro correlations you want to see when trying to generate uncorrelated returns. The more divergences you have on multiple levels, the more opportunity to generate uncorrelated returns.
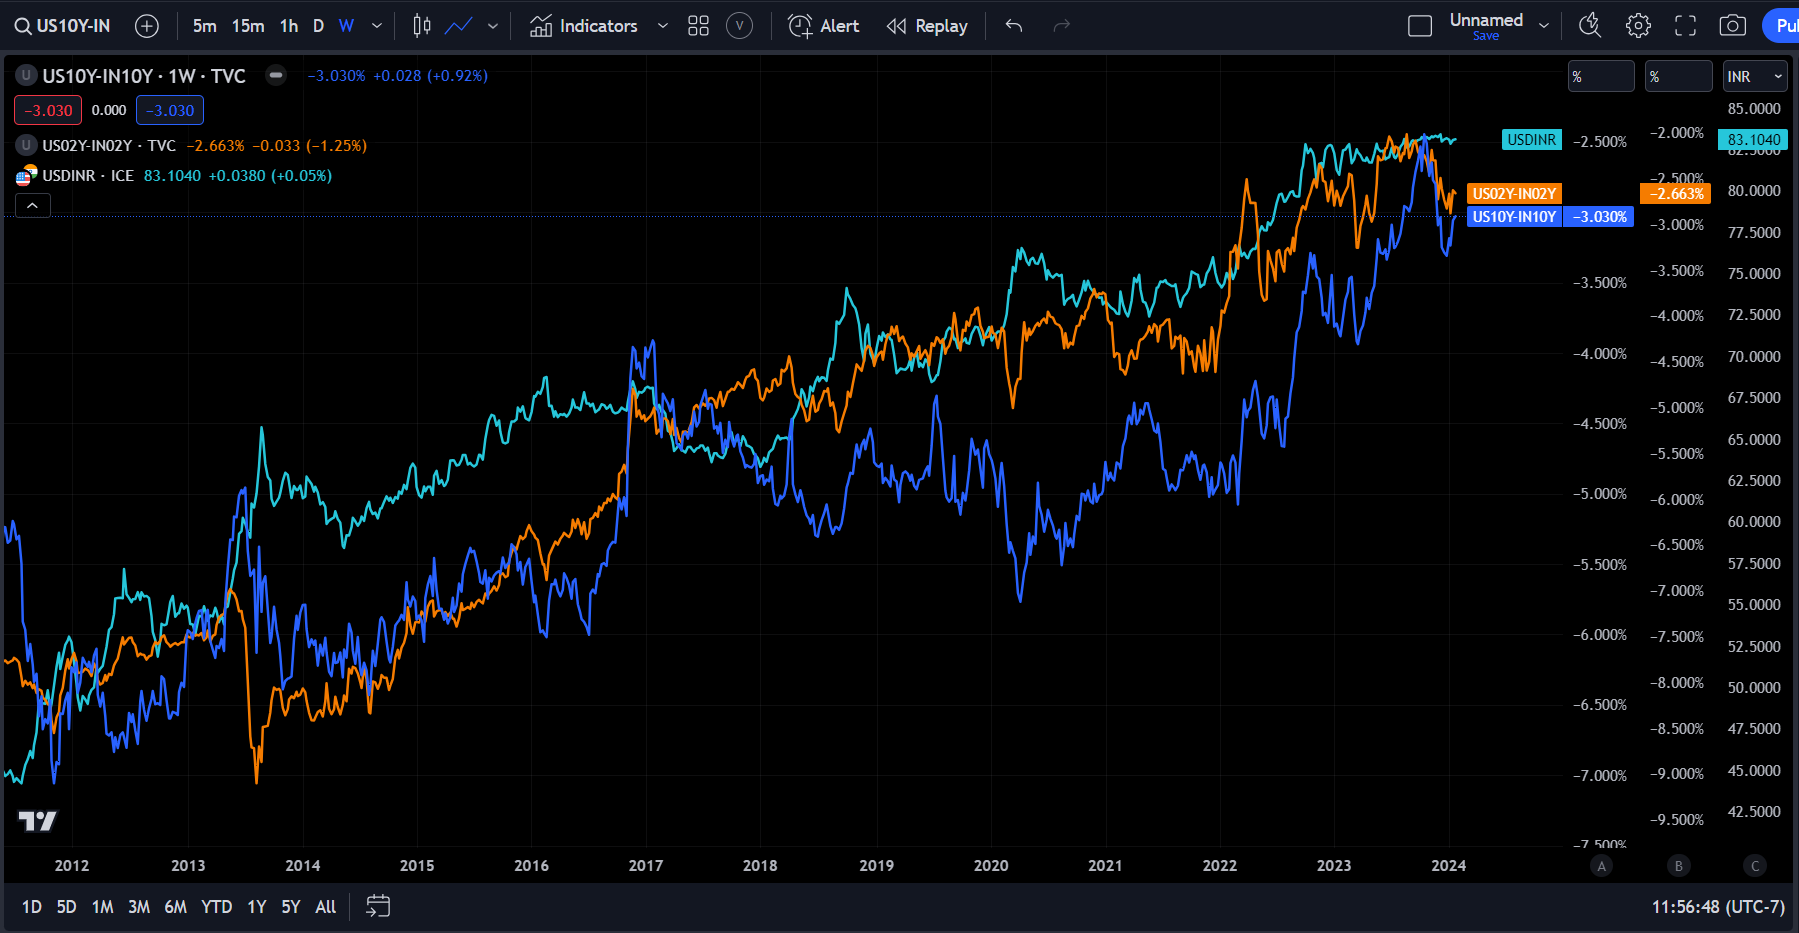
The nominal rate differentials have driven a reasonable amount of the FX price action over the last decade:
Reduced core inflation is expected to enable the central bank to initiate rate cuts beginning in April. Additionally, India's entry into JPMorgan's Emerging Market Bond Index is likely to decrease borrowing costs, thereby facilitating the investments essential for more comprehensive integration into international supply chains.
History of growth, inflation, and liquidity on a structural and cyclical basis:
The history of India's financial markets, in terms of growth, inflation, and currency management, is deeply intertwined with the nation's broader economic policies and central bank actions.
In the early years post-independence, India's focus was primarily on economic self-reliance, which led to a slow growth rate, commonly referred to as the "Hindu rate of growth." This period saw low levels of industrial and stock market activity, with the government heavily regulating the economy. Inflation was generally controlled but at the expense of economic dynamism. The Indian Rupee's value was also tightly managed by the government, leading to a series of devaluations to promote exports. The Reserve Bank of India (RBI), established in 1935, played a crucial role in managing the currency and implementing the government's financial policies during these years.
The liberalization of the 1990s, however, marked a significant shift. Economic reforms led to higher GDP growth rates, with the stock market emerging as a barometer of the economy's health. The introduction of market-driven policies and the opening of the economy to foreign investment led to a surge in stock market activities and growth. However, this period also experienced fluctuations in inflation, partly due to global economic conditions and partly due to internal fiscal policies. The RBI's role evolved during this time to include more active management of inflation, primarily through monetary policy tools like interest rates. The Rupee was made convertible on the current account, leading to a more market-driven exchange rate system. This period also saw the RBI grappling with the challenge of managing the currency amidst increased capital flows, both in and out of the country.
In the 21st century, especially post the 2008 global financial crisis, the RBI's focus has increasingly been on balancing growth with inflation control. The introduction of a formal inflation-targeting framework in 2016 marked a significant evolution in the central bank's approach. This period also saw the RBI undertaking measures to stabilize the Rupee amidst global economic uncertainties and domestic fiscal challenges. The demonetization initiative in 2016 and the implementation of GST in 2017 were significant events impacting inflation and growth. The COVID-19 pandemic further tested the RBI's policies, with the bank taking several measures to support the economy, including rate cuts and liquidity infusion. Throughout these developments, the RBI's role in managing the currency, controlling inflation, and supporting growth has been central to the narrative of India's economic journey. This approach reflects a complex balancing act between promoting economic growth, ensuring price stability, and maintaining a stable financial system.
Current growth, inflation, and liquidity regime and its connection to each financial asset:
India is currently in a regime of positive growth, decelerating inflation, and likely the beginning of a positive liquidity impulse from the expectation of the central bank beginning cuts this year.
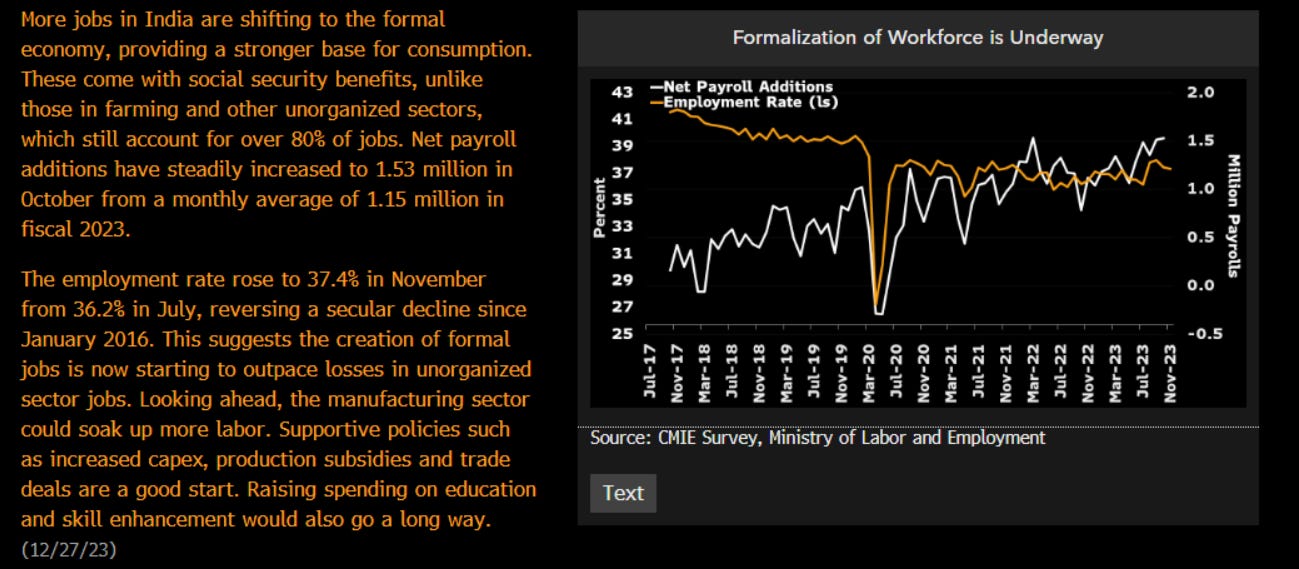
The increase in fixed capital formation I noted above is being matched with positive strength in the labor market:
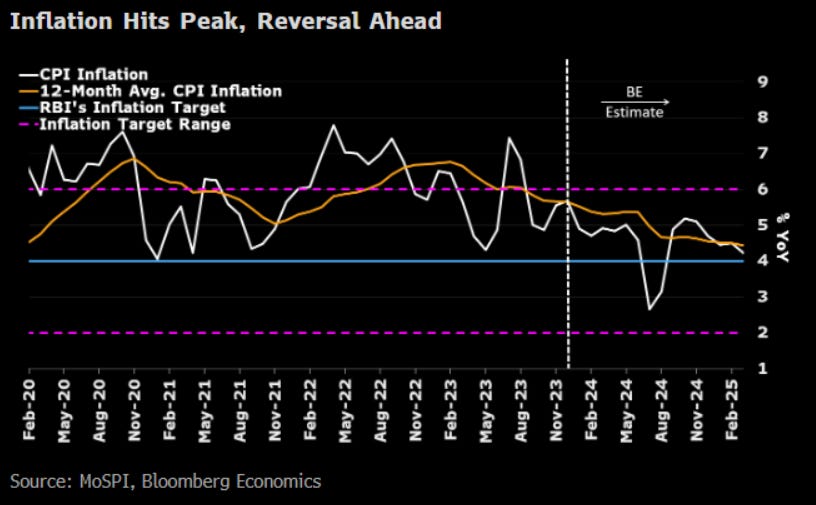
Inflation is nearing the central bank’s target which is increasing the probability of cuts in April:
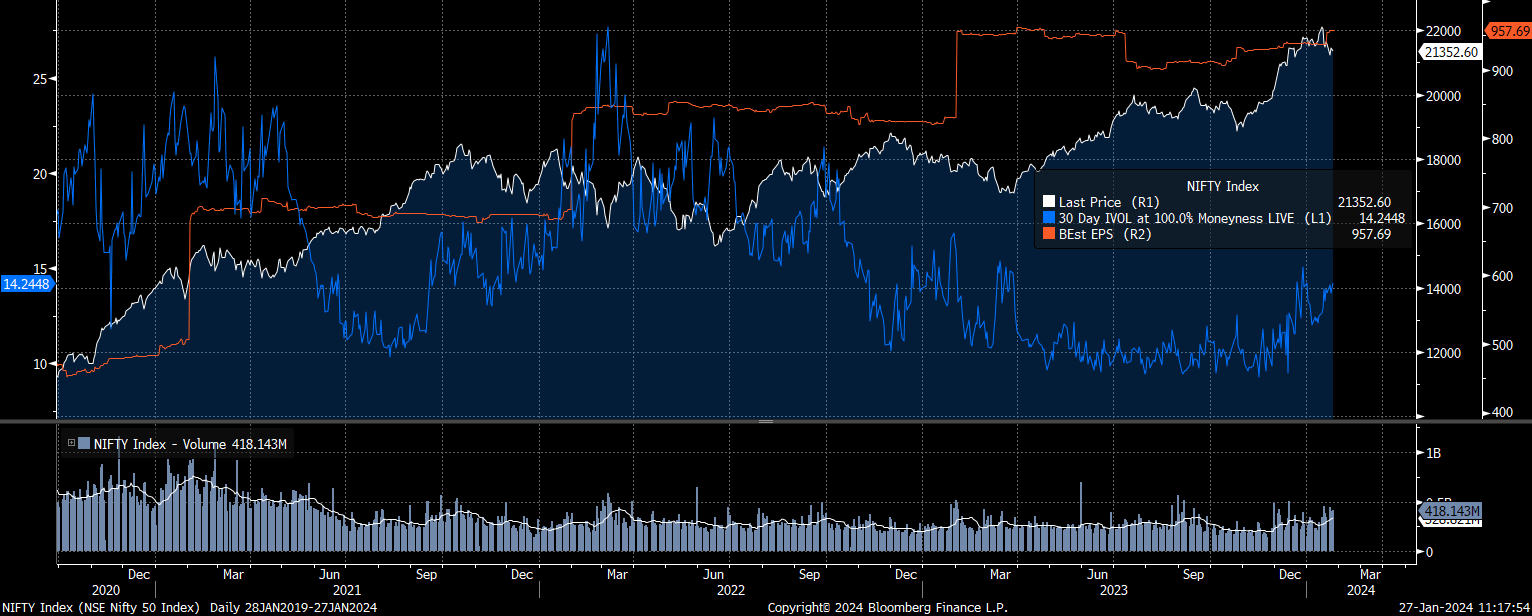
As I noted at the beginning of the primer, watch the positioning dynamic we have been seeing with the short China / Long India trade. Growth is strong in India but the valuation function can unwind some positioning:
Earnings expectations (orange) continue to move up but notice the most recent move in implied volatility (blue) that occurred with a bullish move in the index. This is key because it shows positioning putting up enough exposure to actually cause call skew to blow out.
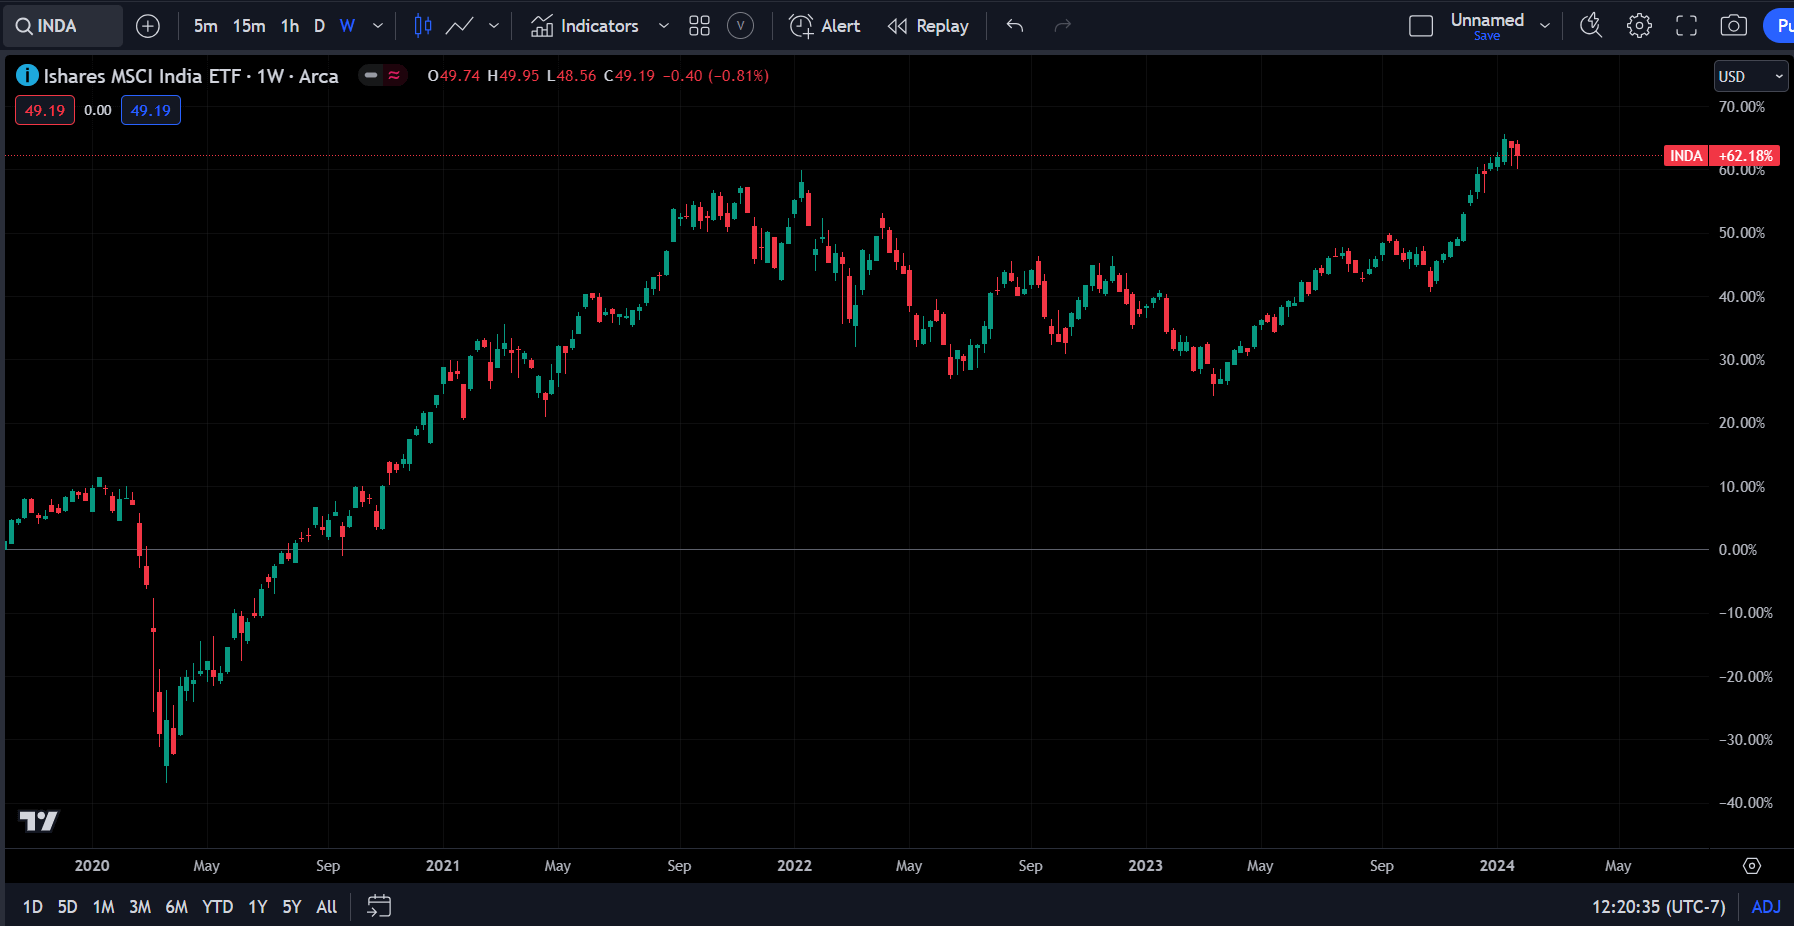
I have a bullish view of Indian equities but would watch the positioning tension with China carefully here. The INDA ETF is a decent expression but selecting specific sectors and stocks can provide a better expression.
Additional resources for research and trading in Indian markets:
Top books to read on India:
"The Republic of Beliefs" by Kaushik Basu
"The Argumentative Indian" by Amartya Sen
"Imagining India" by Nandan Nilekani
"India After Gandhi: The History of the World's Largest Democracy" by Ramachandra Guha
"The Indian Economy Since 1991" by B. A. Prakash
"The Dhandho Investor: The Low-Risk Value Method to High Returns" by Mohnish Pabrai
"Bulls, Bears, and Other Beasts" by Santosh Nair

Top academic papers to read on India:
https://www.imf.org/en/Publications/WP/Issues/2022/08/26/Indias-State-Owned-Enterprises-522657
https://www.imf.org/en/Publications/WP/Issues/2023/04/21/Unleashing-Indias-Growth-Potential-532616
https://www.elibrary.imf.org/view/journals/001/2023/147/article-A001-en.xml
Conclusion:
We have covered a lot in the country primers! 5 Country Primers and the first month of the year isn’t even over yet. I have appreciated all of the positive feedback from you and am looking forward to building on these even more.
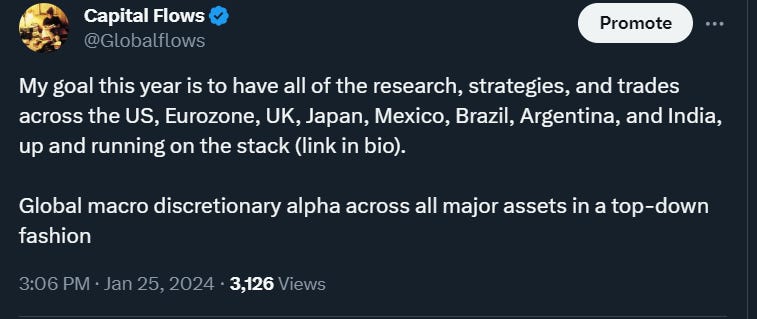
I shared this Tweet and I just want to reiterate that I appreciate each of you



We are in it together! Feel free to reach out any time via Twitter DM or email even if it’s just to say hi and introduce yourself. There might be a little lag but I will ALWAYS respond!
Be well!
Absolutely 🤝
Thanks a lot for obliging the request to do a cover story on India. Thanks once again.