


Intro To Country Primers:
Global macro trading is made up of generalists who morph across all countries in the world to find asymmetrical returns. To identify asymmetrical returns, you need an exceptional knowledge of every country, sector, and asset in the world.
Being a true generalist and polymath in today’s world is becoming rare because extreme specialization is taking over every industry. There are now entire teams at every major hedge fund that ONLY focus on a single sector or country.
When I think about competing in financial markets, I never want to compete against people who operate at the top of their specialized fields. Instead, I want to identify the silos of knowledge and the limitations specialists face. The job of the generalistic in today’s modern society of extreme specialization is to use their breadth of knowledge to identify what specialists have difficulty seeing.
Discretionary global macro with the flexibility to operate across any country, sector or asset class is the “final frontier” of trading. As every risk premia and strategy is turned into a beta that is managed, it’s the generalists that will generate the alpha.
It is with this goal that I am embarking on writing Country Primers. I have already written primers that break down the basics of global macro and HOW to construct a framework properly (link). We are now going to build on this foundation to create frameworks in every major country.
If you haven’t gone through the foundational articles for this Substack, I would encourage you to go through them. The ones on FX will be especially helpful for our purposes. Here are all the major ones (see full list here: link)
Research Framework:
Positioning and Microstructure
Strategy Development and Risk Management (Guest Writer!)
Risk Management Primer (Guest Writer)
The Research HUB: Regime Shifts
The Research HUB: Trading Gamma Squeezes
Macro Report/Insights: GIP Path Dependencies
The Research HUB: Unlimited Upside and Adaptive Risk Management
Brainstorm: Learning About Economics
The Research HUB: How does economic data get priced into the market?
The Research Hub: What Is TRUE Diversification?
THE Model for taking bets in markets (and life) - Free Excel Model Included
The Research HUB: CPI Excel Model
Educational Primers:
Risk On/Risk Off Regime Primer
The Research HUB: How Crypto Fits Into Macro Flows
FX Primer
Japan Primer:
Overview: Here is the structure for this primer
Country Overview
Geography and Demographics
Economic Data: GDP, GNI, BoP, and Balance Sheets
Financial Markets: Stocks, Bonds, and the Yen.
History of growth, inflation, and liquidity on a structural and cyclical basis
Current growth, inflation, and liquidity regime and its connection to each financial asset
Additional resources for research and trading in Japanese markets
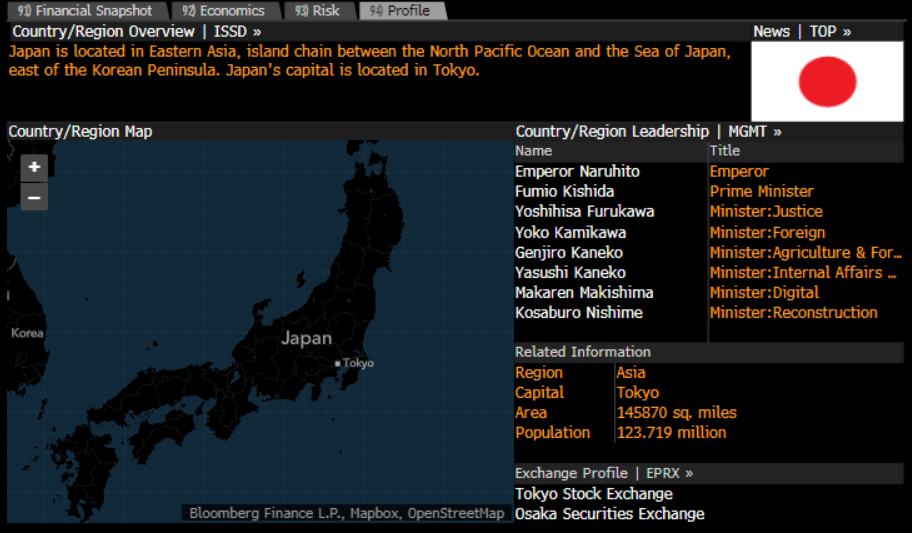
Country Overview
Japan opened its ports in 1854 and began to intensively modernize and industrialize. During the late 19th and early 20th centuries, Japan became a regional power. After its defeat in World War II, Japan recovered to become an economic power and an ally of the US. While the emperor retains his throne as a symbol of national unity, elected politicians hold actual decision-making power.1
Geography and Demographics
The geography and demographics of a country create the context and constraints for the levers of growth, inflation, and policy to function.
Geography:
Main Idea: Japan has poor land for agriculture and natural resources but it is optimal from a strategic perspective.
Natural Resources: negligible mineral resources, fish; note - with virtually no natural energy resources, Japan is almost totally dependent on foreign, imported sources of energy2
“It all has to do with the Japanese’s solution to its geographic shortcomings: with land-based options so poor, the Japanese had no choice but to go to sea, but they did so in a manner wholly different from the English”3 (all quotes regarding geography below are from Disunited Nations by Zeihan).
“Japan’s topography made its roads so difficult and expensive to construct and maintain as to be irrelevant….but once you could float a boat, towns near and far were just a sail away. Such naval connections - both hostile and friendly - weren’t just Japan’s primary infrastructure, but also its political unification process.”
“Japan had to have a navy to unite its country, and it had to open up to the world to avoid being plowed under by the empires”
As recently as 1800, Japan was the only local power that had any semblance of unity, and after Japan’s forced opening to the world, it was the only local power with steamships and firearms. United enabled the country to take full advantage of the new industrial technologies, and Japan instantly became the dominant regional power.”
“Japan doesn’t have any big swaths of flatland. Japanese cities are crammed into tiny footprints. They can neither easily expand nor easily integrate to achieve economies of scale. If they want to get bigger, they must go up, not out. High development costs forced Japan to move up the value-added scale as quickly as possible. It wasn’t enough for the country to import and use the new technologies; its cities were too crammed to be competitive with the lower capital costs of other centers in the industrial age. Japan had to not only master the technologies but also advance them.”
“No matter how a country industrialized, there’s a list of nonnegotiable inputs: labor for the factories, iron ore for steel smelting, and coal and oil to power the process. Of that list, Japan had only labor. Applying outside technologies required that Japan venture out to secure industrial inputs. Modernizing and industrializing in an era without free trade demanded Japan become an empire.”
Post-WW2, Japan’s economic boom took place under the American nuclear umbrella. In a single generation, Japan recovered from WW2 to become the second-largest economy in the world.
You can begin to see how the geographic constraints of Japan begin to frame its international relationship with the world. This geographic and geopolitical dynamic will be reflected and quantified when we come to the Balance of Payments and GDP structure of the country.
Demographics:
When you have an intensified focus on urbanization, this naturally leads to fewer children. This is simply due to space, the cost of raising children, and the absence of suburbs. You can see the connection between Japan’s geography, its lack of natural resources, industrialization, and resulting demographics. This will eventually connect with the labor market data metrics below.
Japan has a very old population. They have the highest proportion of retirees in its population. This has implications for how savings and taxes flow through economic data.
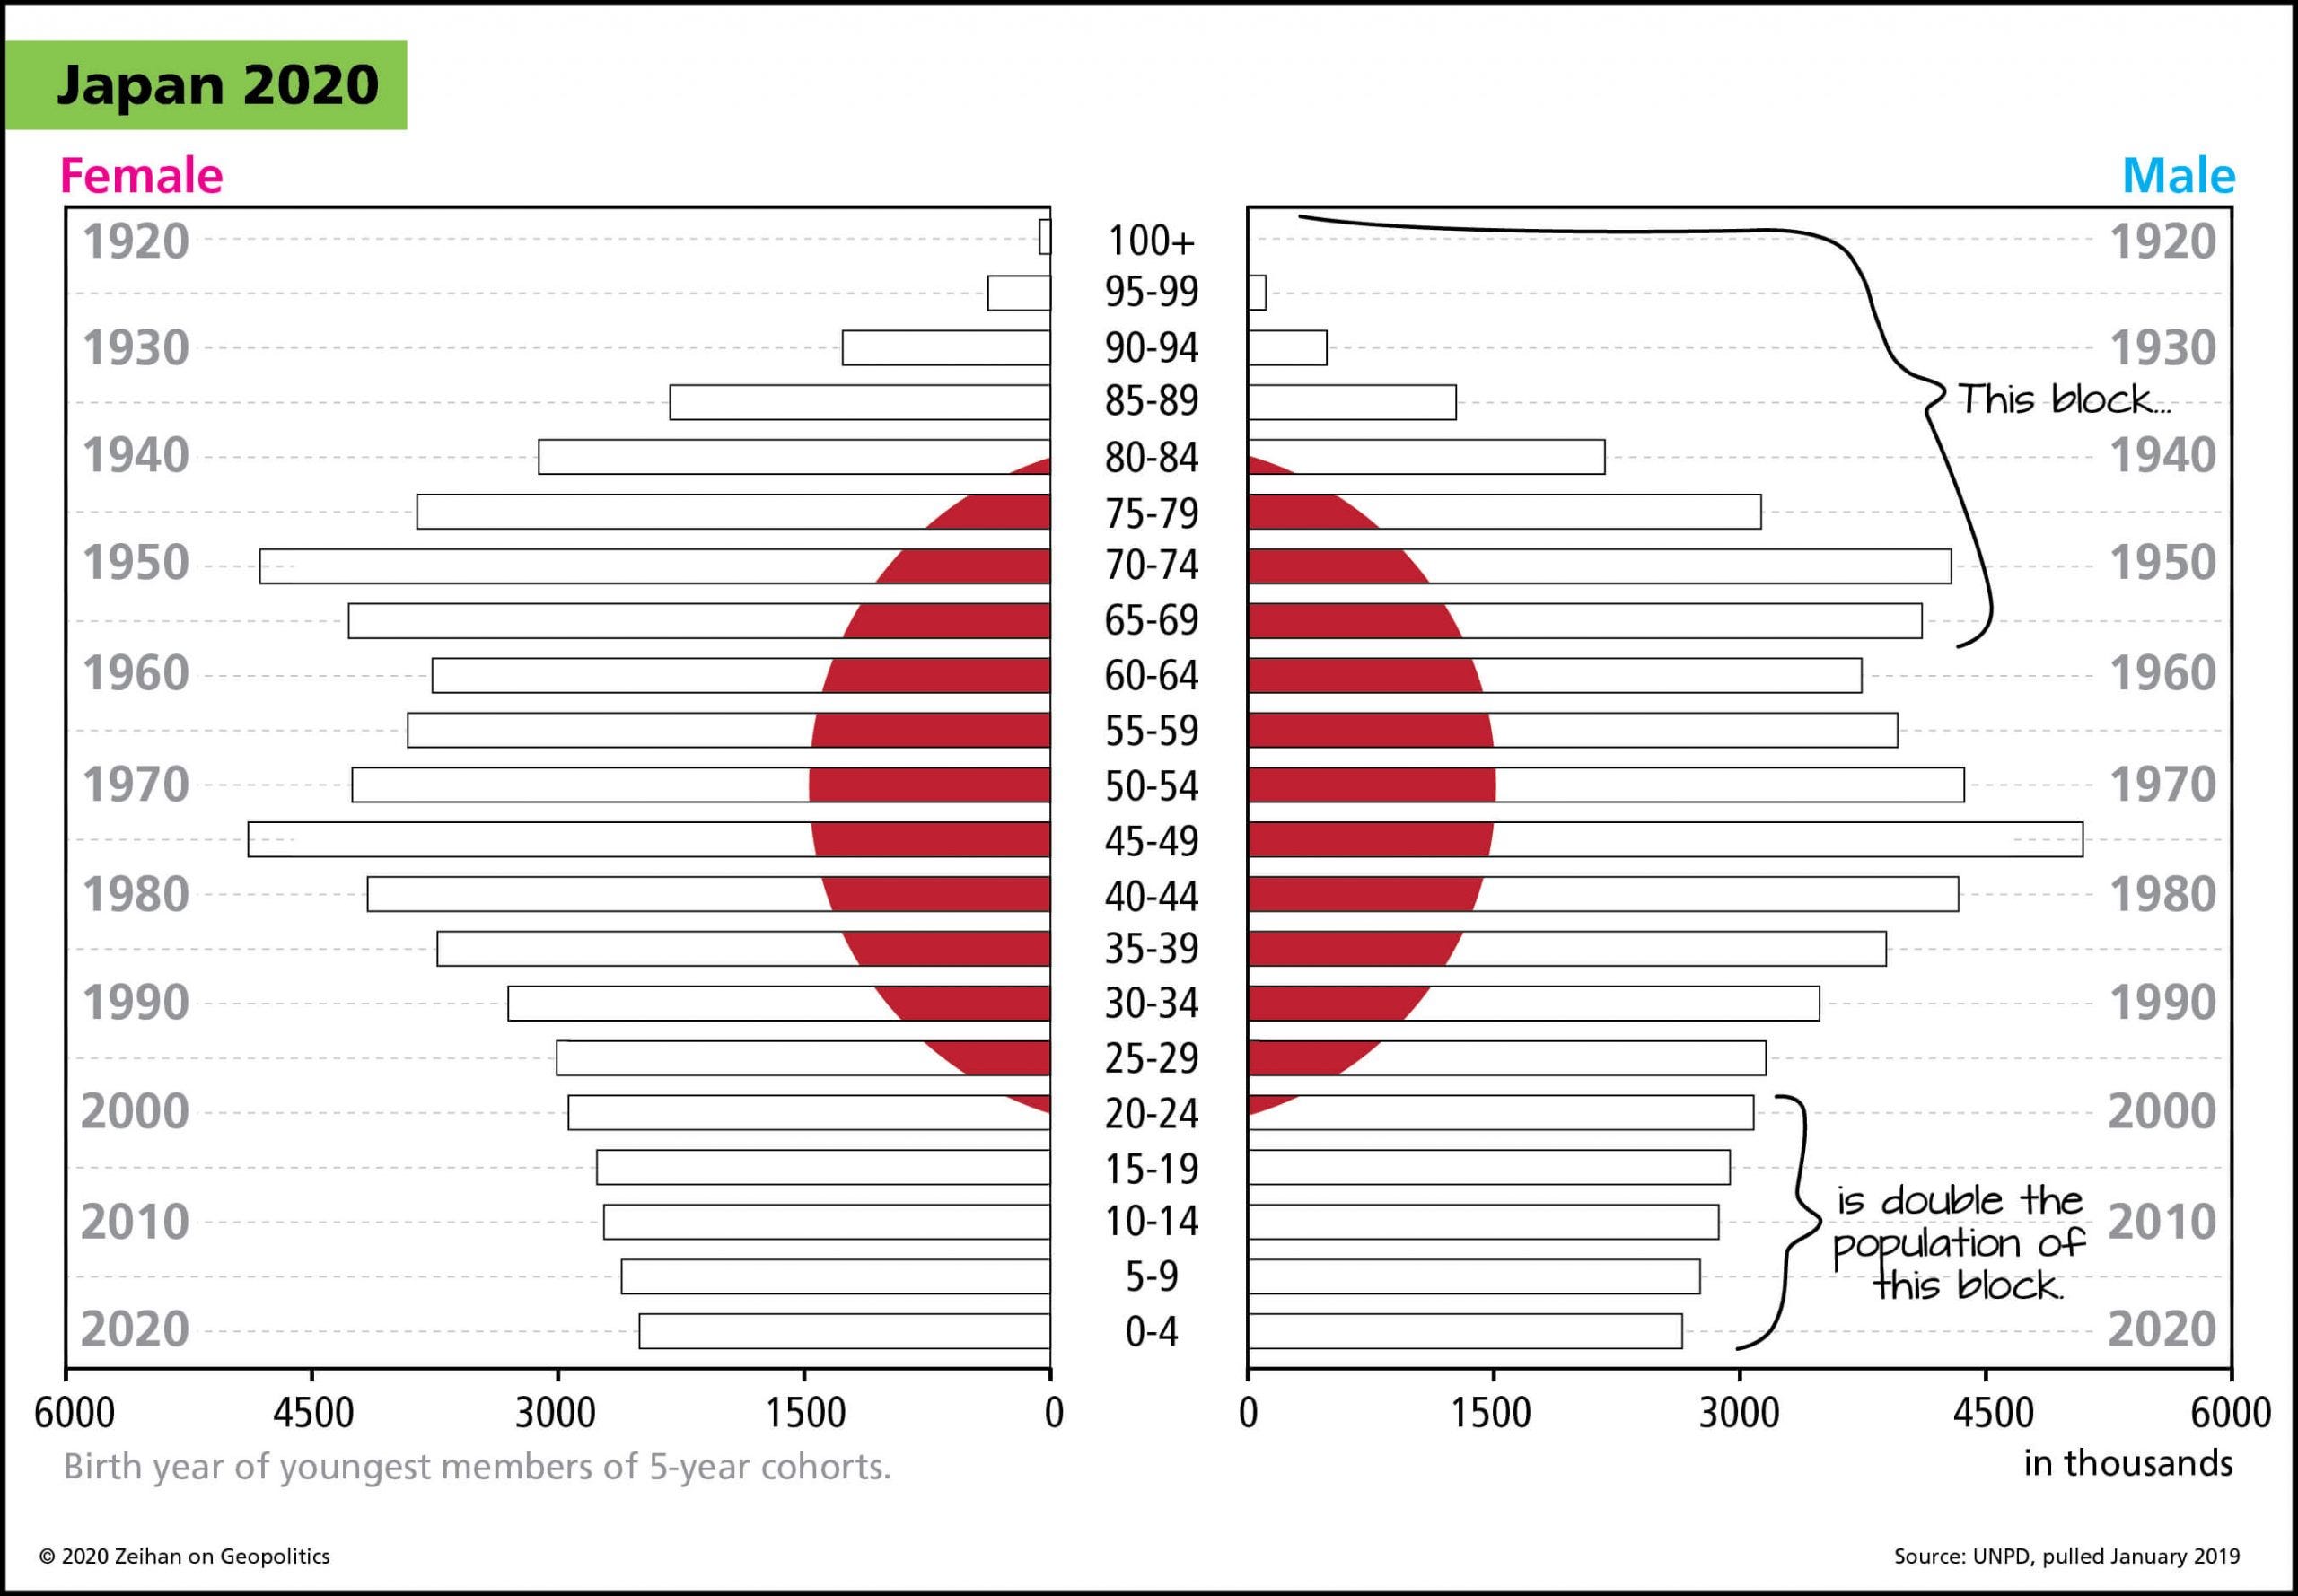
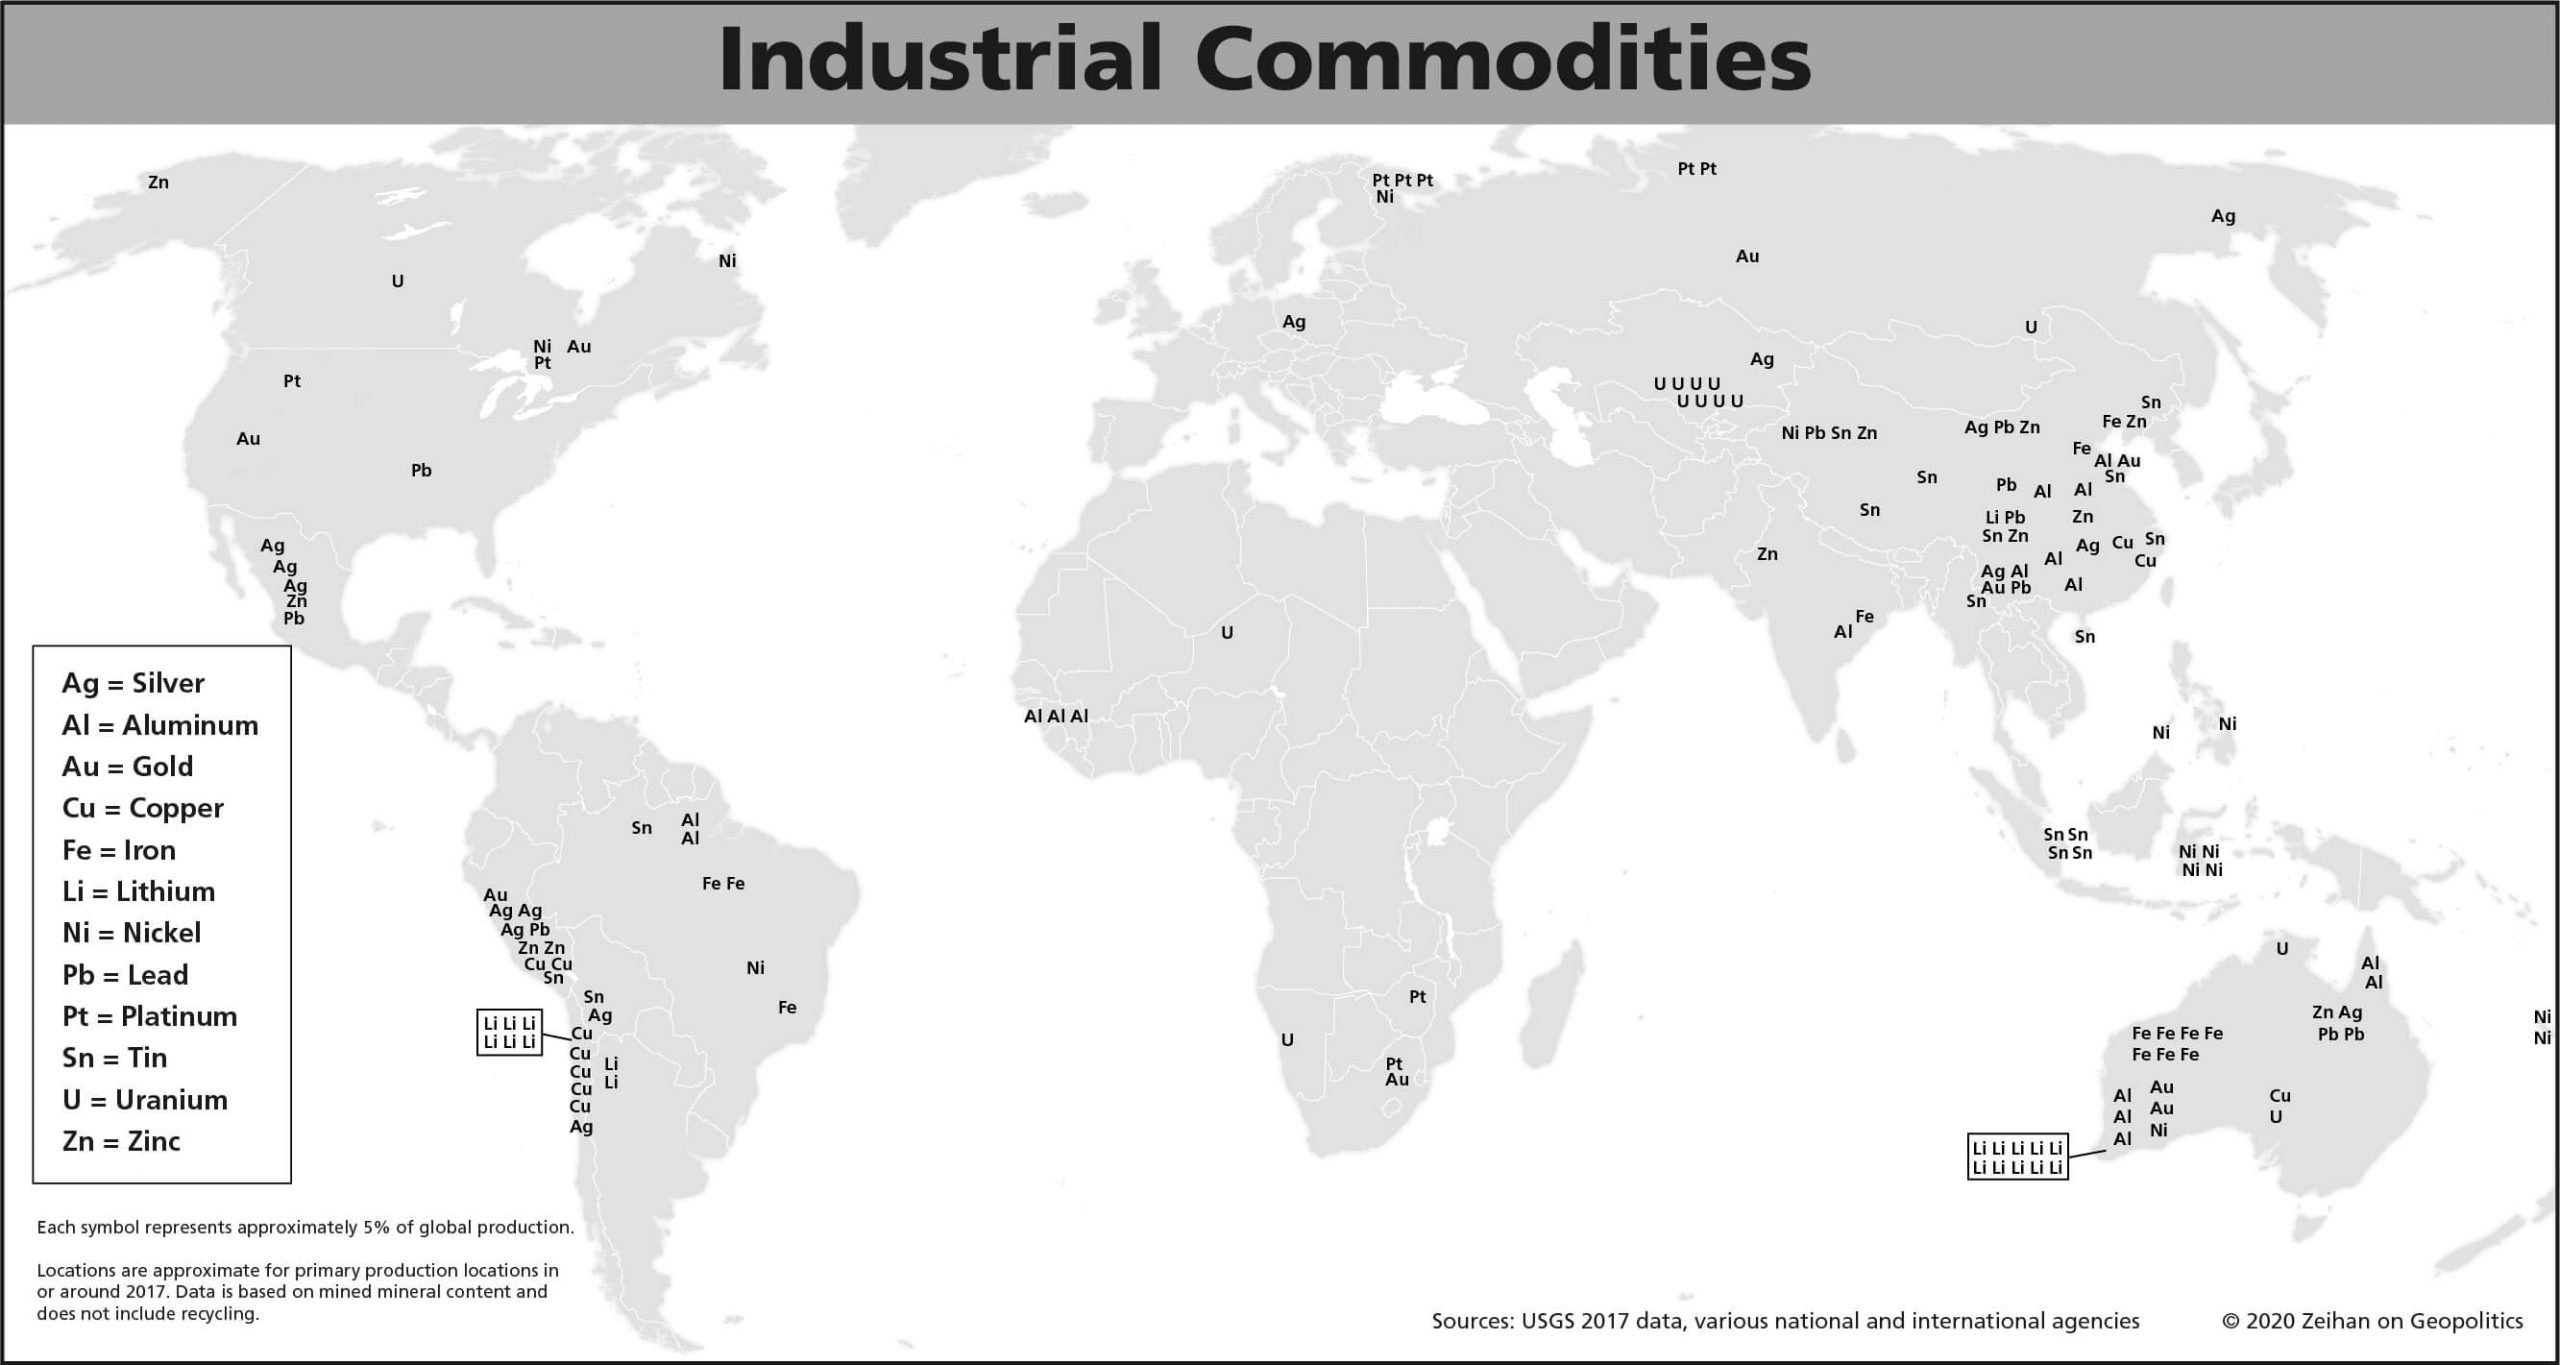
The combination of needing to source all major materials externally and an aging demographic creates considerable risks for Japan.
Industrial Commodities Map (notice none of them are in Japan):
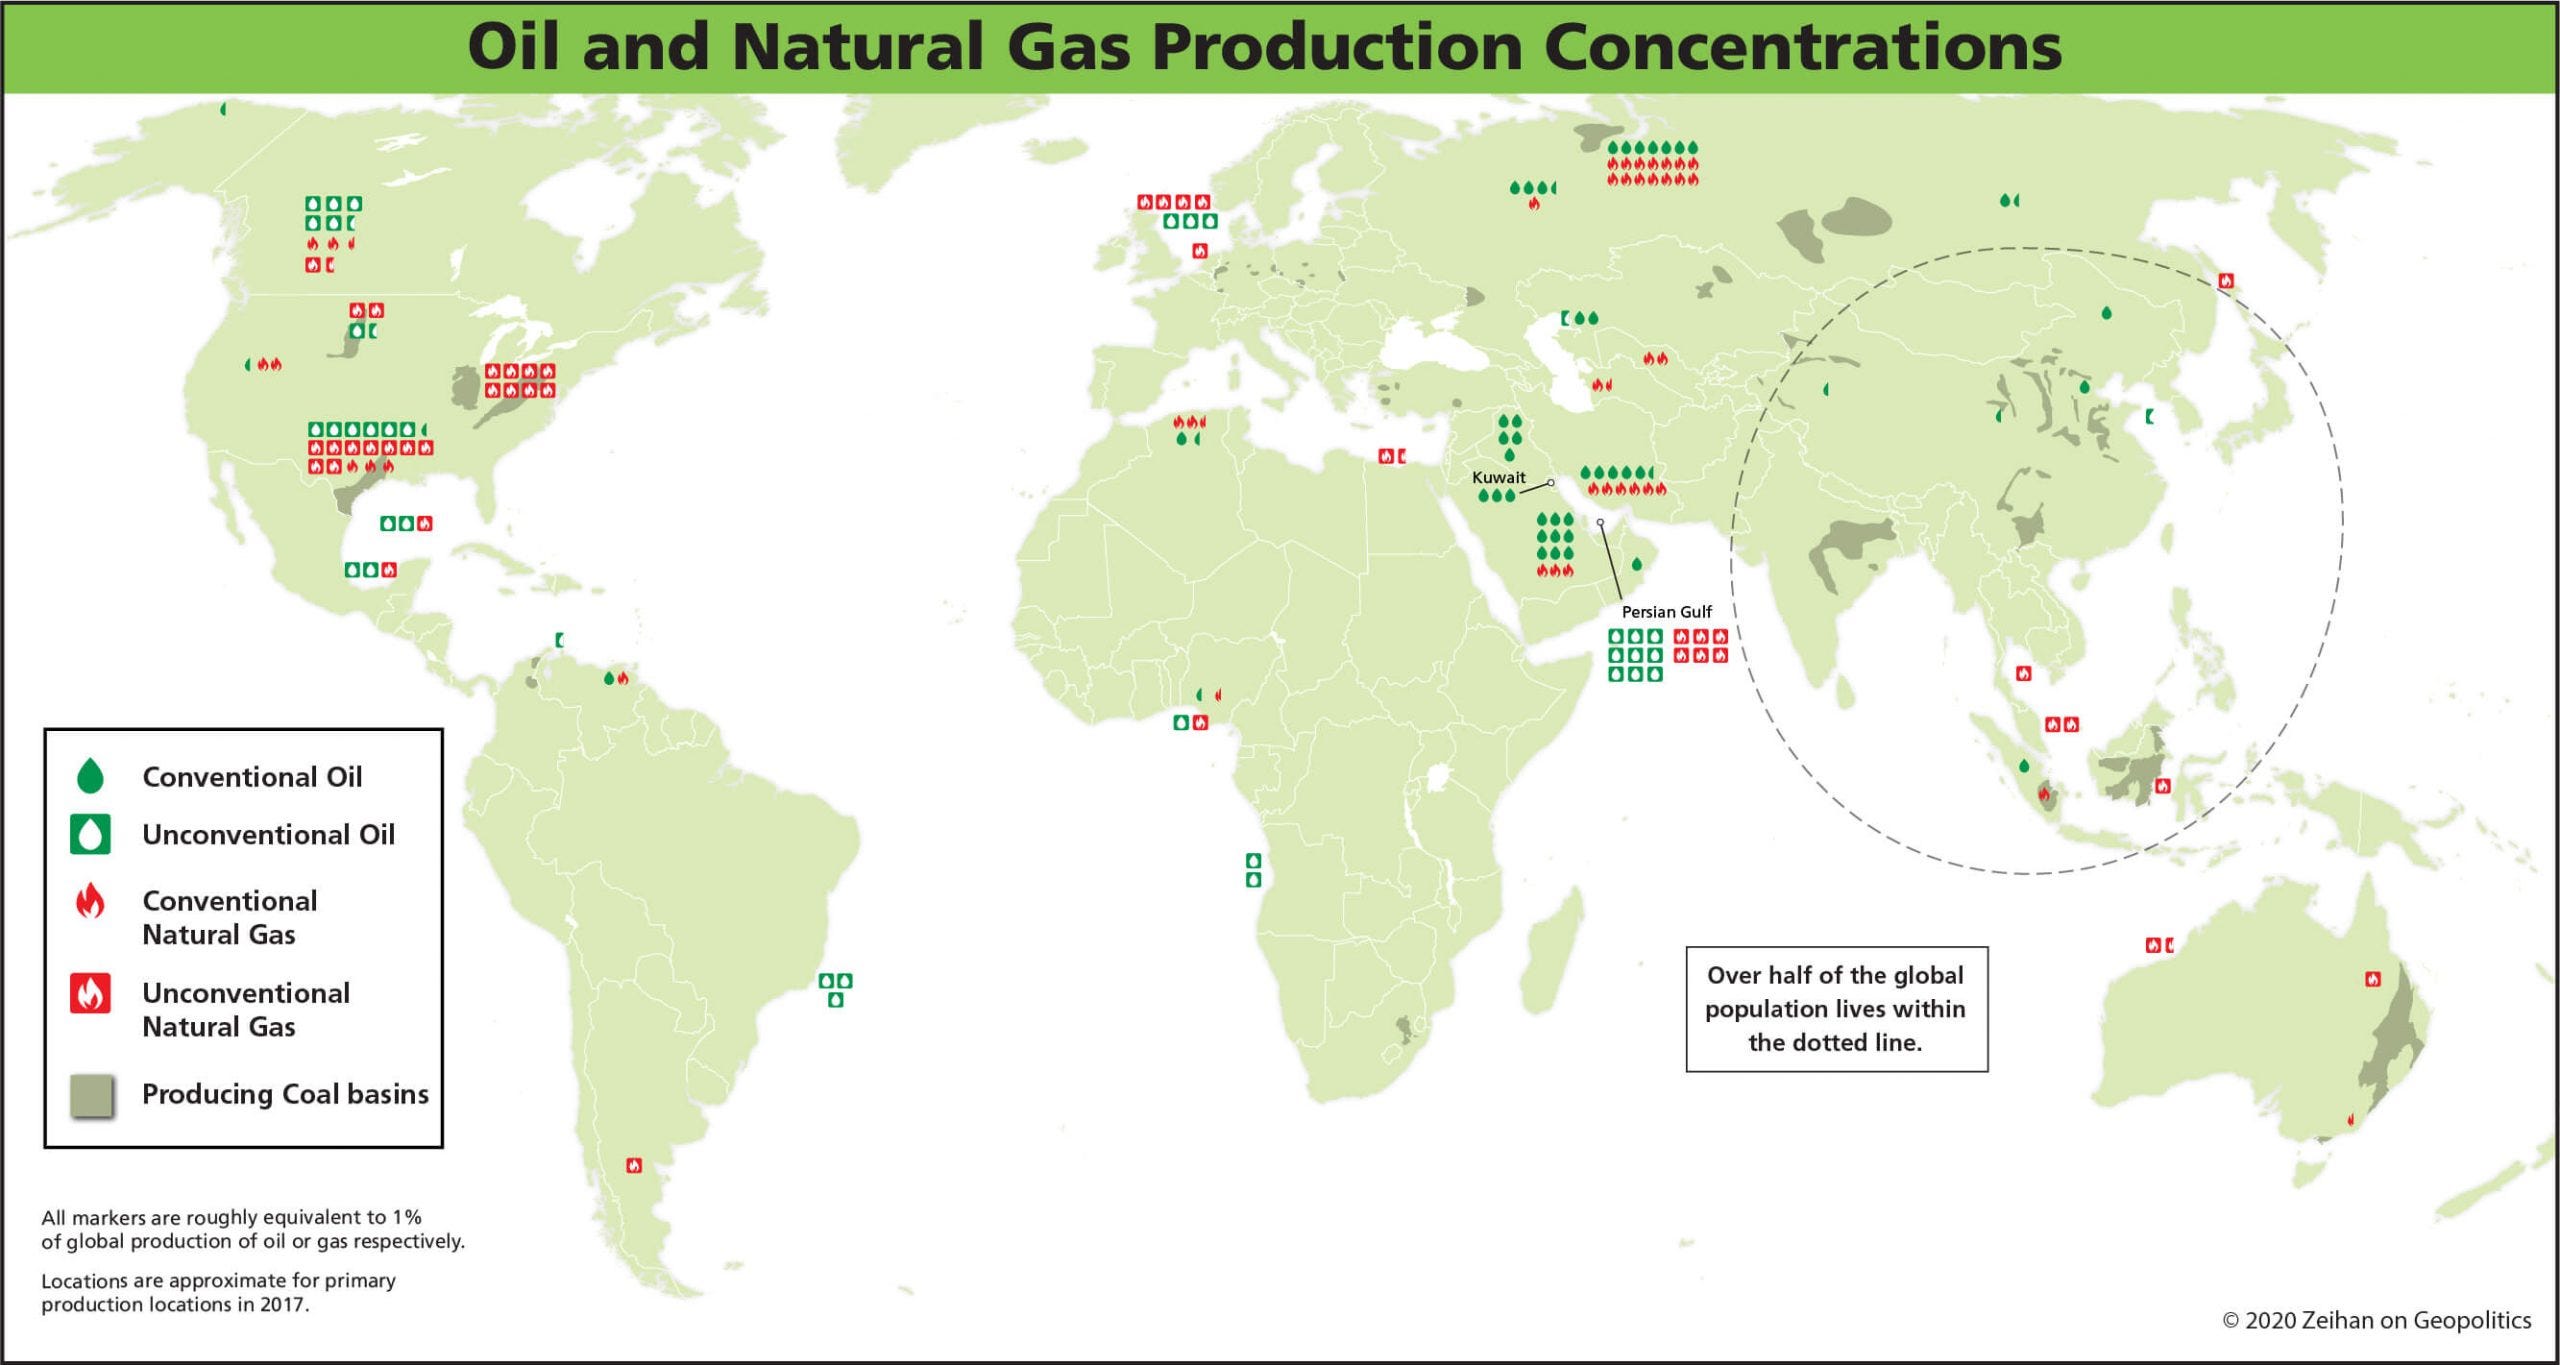
Same story with energy (this is one of the reasons CADJPY correlates with crude prices. CAD is a currency directly levered to oil production while JPY is fundamentally short oil):
A primary benefit Japan has on its side is outsourcing. Japan has outsourced a large degree of its production because it is aware of its inherent risks. Japan has outsourced to countries with stable and growing demographics.
“Japan is now one of the world’s least trade-dependent countries. It keeps much of the high-brainpower work - especially design - at home.” 4
Here is the report card summary from Peter Zeihan’s book, Disunited Nations:
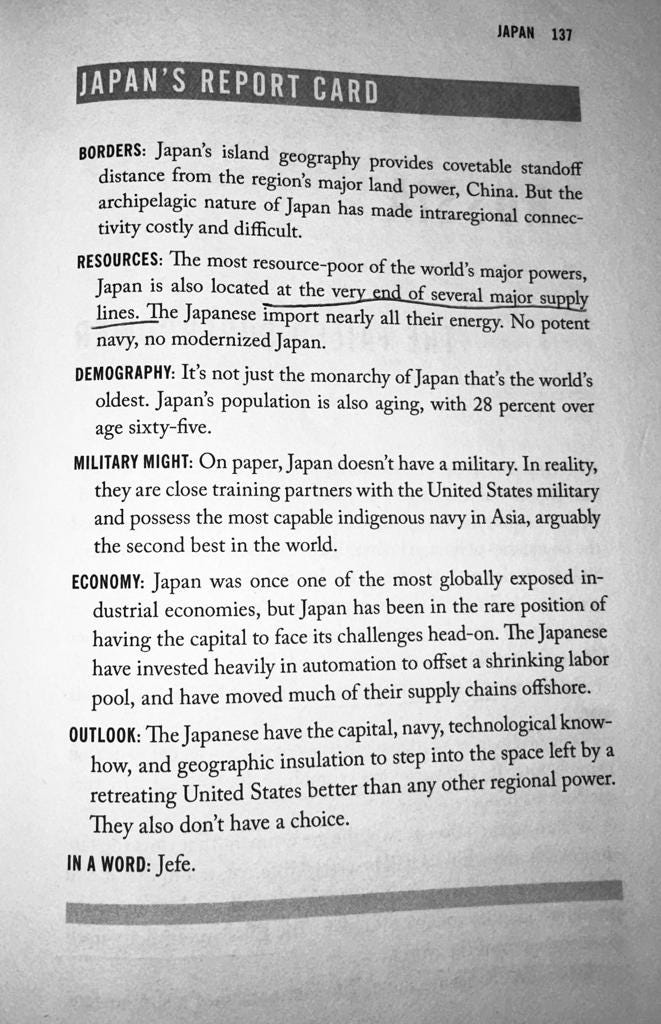
Summary:
This is the international context for Japan as a country. Demographics and geography are the two primary constraints that exist in macro. However, macro flows and capital structures operate within these and need to be quantified correctly.
Demographics’ connection to growth and inflation: There is a significant debate among all the macro nerds about demographics being inflationary or deflationary. Here is what I will say, there CAN BE considerable connections between growth/inflation and demographics. I personally don’t view an inherent connection simply because there are so many additional variables that can offset things. In my mind, demographics are an important variable to know when analyzing labor market data but the outright implications (meaning they are inherently inflationary or deflationary) that can be drawn from them are limited. For example, to outright say demographics are deflationary doesn’t account for any variability or path dependency in the actual causal factors of demographics.
If you want to dig into this dynamic more, check out the following resources:
The Price of Time by Edward Chancellor is a great book and has a lot of good BIS citations.
Economic Data: GDP, GNI, BoP, and Balance Sheets:
Now that we have the big-picture context for Japan, we need to quantify each moving part of the economy with data. When we approach economic data, we want to quantify the FLOW and CAPITAL STRUCTURE for each agent (households, corporates, sovereigns, financial institutions). If you want a good book on this, check out The Volatility Machine.
Let’s start big picture:
Here is a chart of Nominal (white) and real GDP (blue) on a YoY basis:
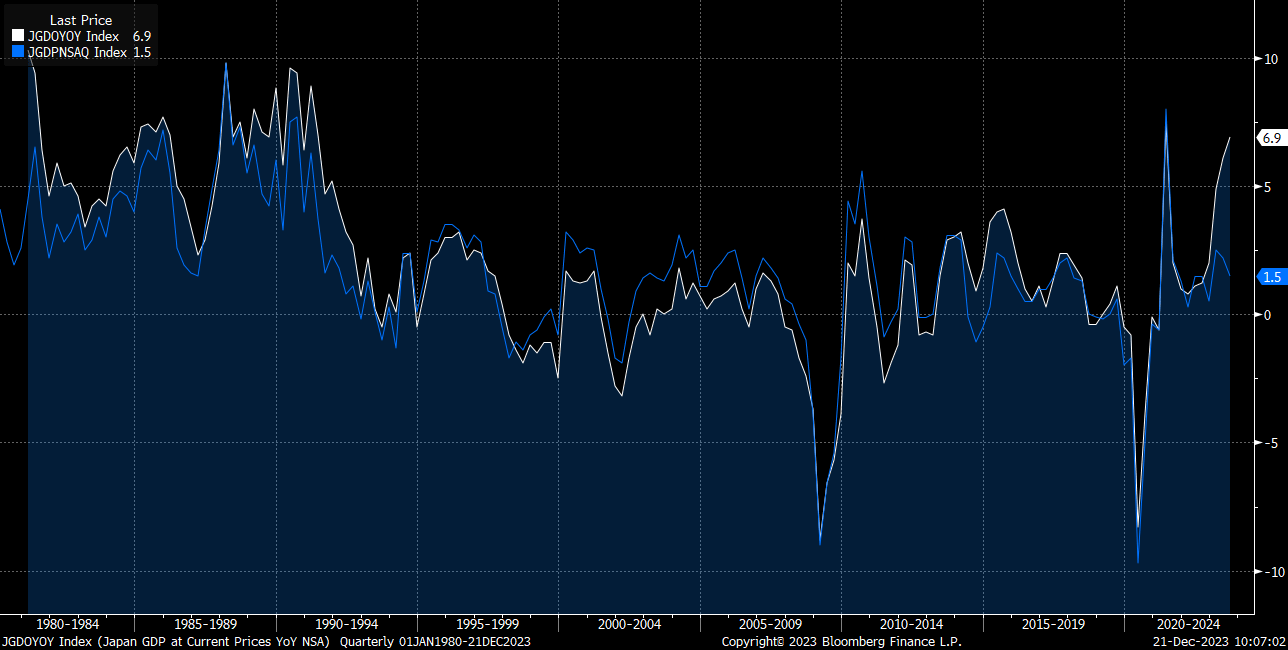
Real GDP:
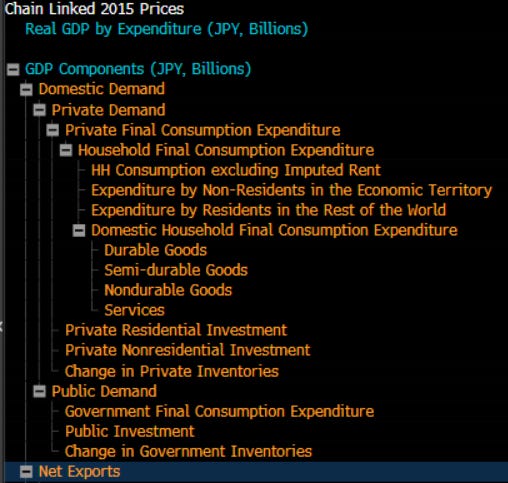
GDP is broken into private demand, public demand, and import/exports:
Here is a chart of the components of real GDP as a % of total real GDP.
Real Private demand / GDP = White
Real Public demand / GDP = Yellow
Real Net exports / GPD = Green
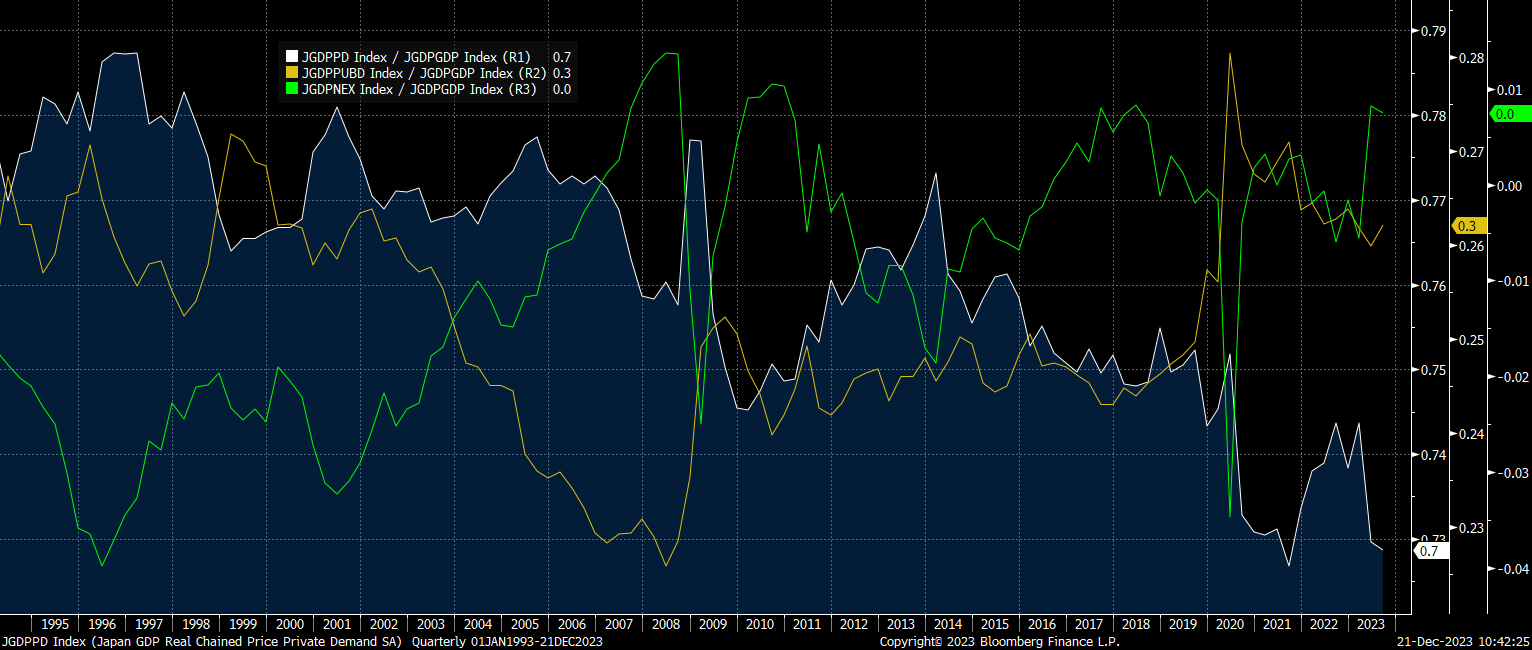
While there is a clear downward trend in private demand as a % of overall GDP, it remains the largest contribution:

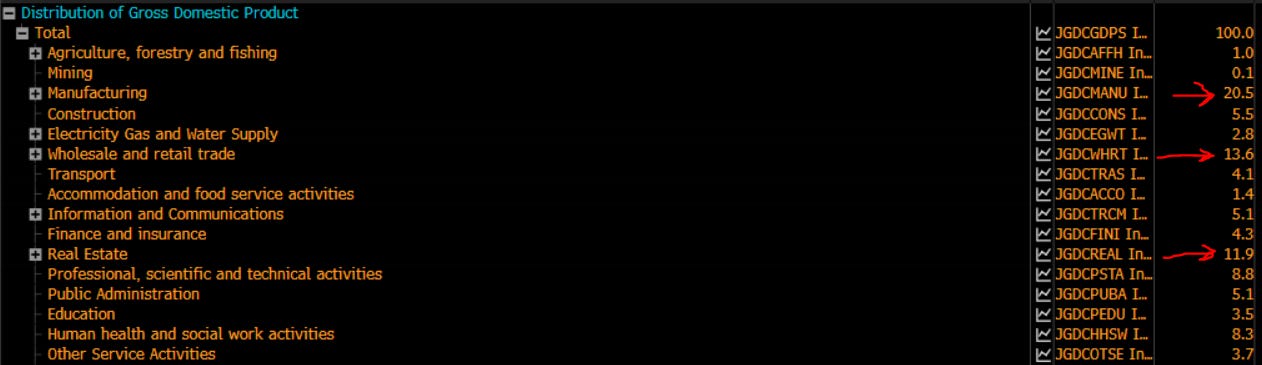
Here is a breakdown of industries as a % of GDP:
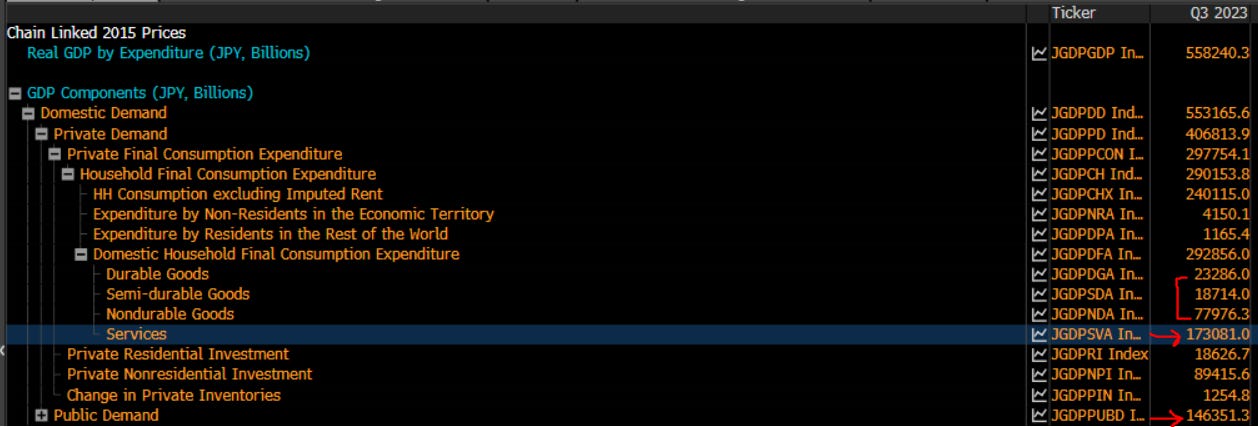
It is important to note that similar to the US, services are a significant portion of consumption:
Now we have a basic understanding of GDP and we can have a rough proxy of each of these components by using monthly data. All of the data should be on the CME tool: https://www.cmegroup.com/tools-information/quikstrike/economic-event-analyzer.html
Digging Deeper:
From here we want to dig into the balance of payments and balance sheets of the country.
Total Private credit by the non-financial sector is at 414% of GDP (purple). This is comprised of households at 67% of GDP (white), nonfinancial corporations at 116% of GDP (blue), and the government at 230% of GDP (orange).
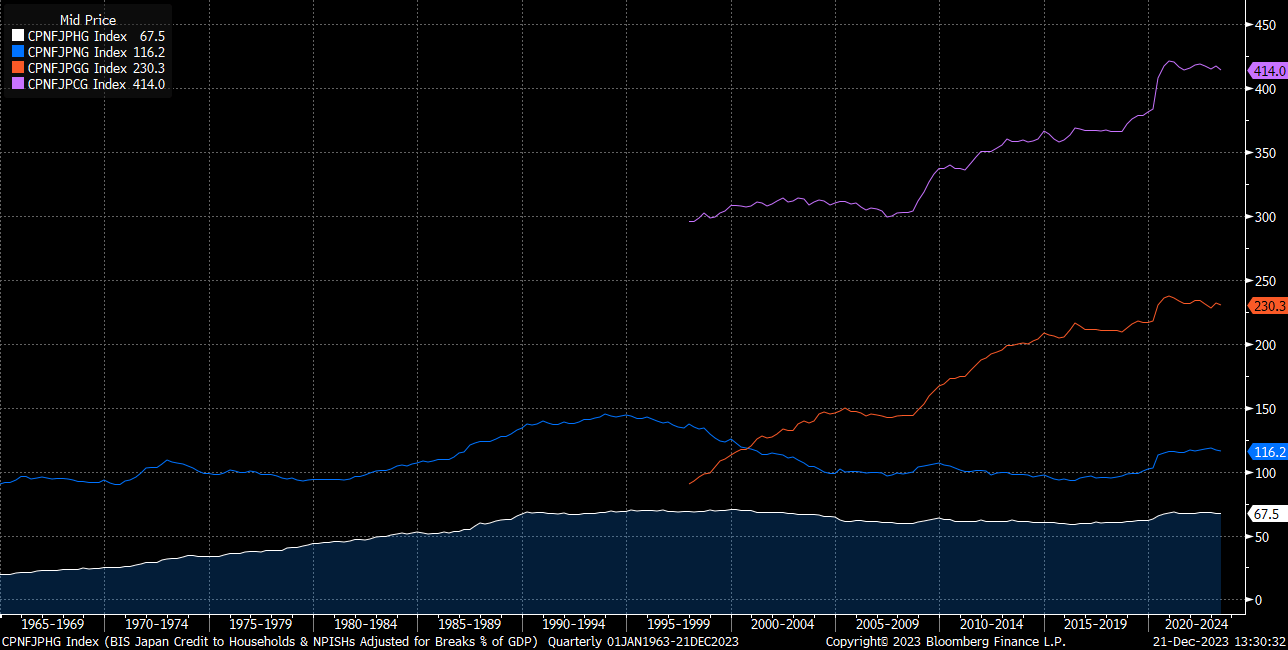
The chart above shows that the government has the most debt outstanding as a % of GDP. The key thing to note is that the BoJ is the primary holder of this debt:

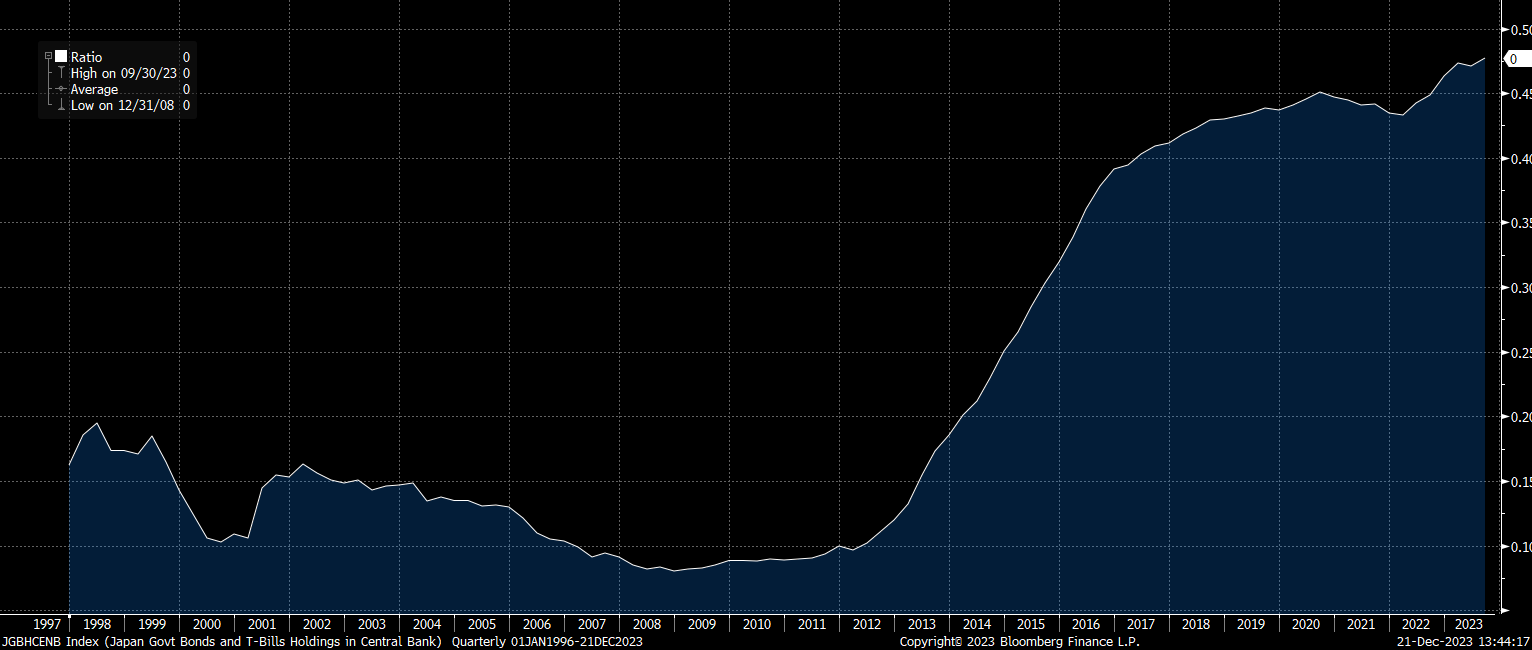
When we look at the BoJ’s holding of government debt as a ratio of total government debt outstanding, it continues climbing. This shows the prominent role the BoJ has in funding the Japanese government:
The BoJ is at the top of the list of holders:
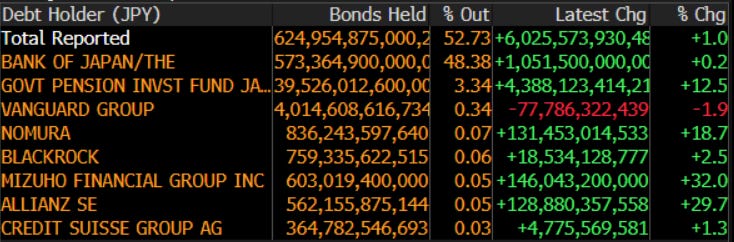
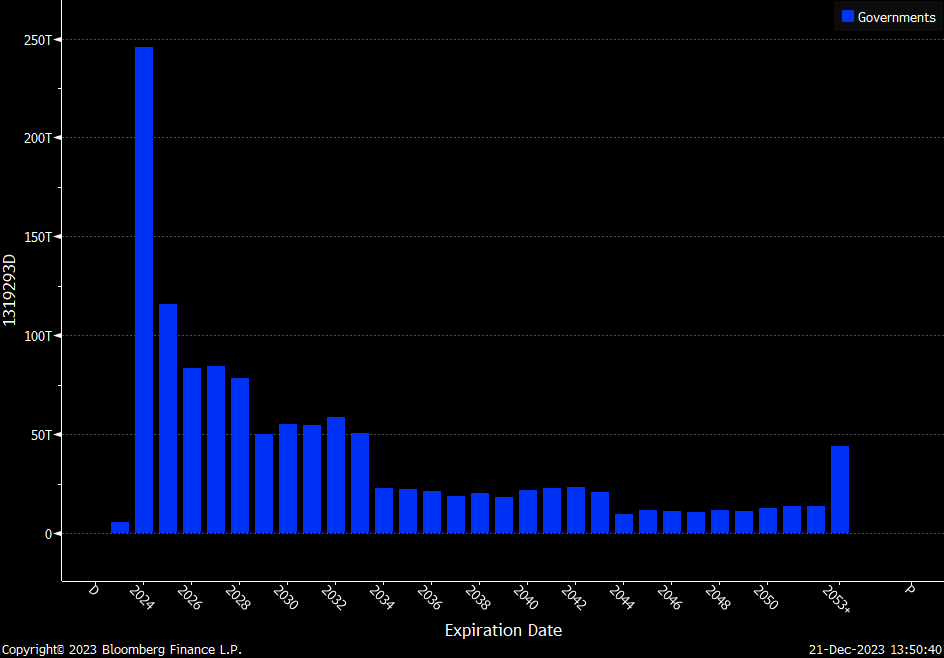
And the debt distribution of JGBs is all incredibly short-term. This doesn’t necessarily imply the Japanese government is close to default. On the contrary, as long as the debt is in the issuer’s own currency, they can continue to roll their debt with the help of the central bank. If the purchasing power of the currency begins to be impacted relative to domestic spending or foreign returns, this will be reflected in the FX market:
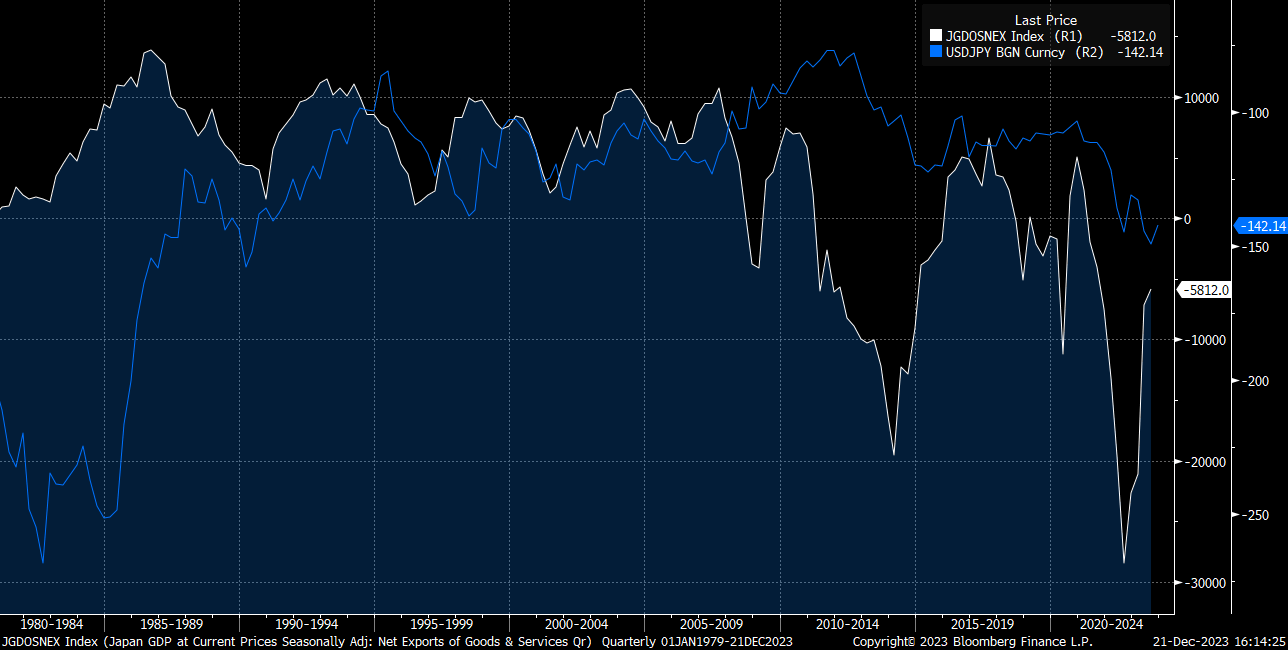
This dynamic with the BoJ directly influences the Yen which all Japanese assets are denominated in. Since the balance of payments ALWAYS needs to be balanced, the capital account and current account are impacted by fluctuations in the Yen.
Japan ran a current account (white) surplus for a significant period of time until recently. Below is a chart of the current account and USDJPY (inverted):
As capital has flowed through Japan’s balance of payments, the country has increased its holdings of US Treasuries:
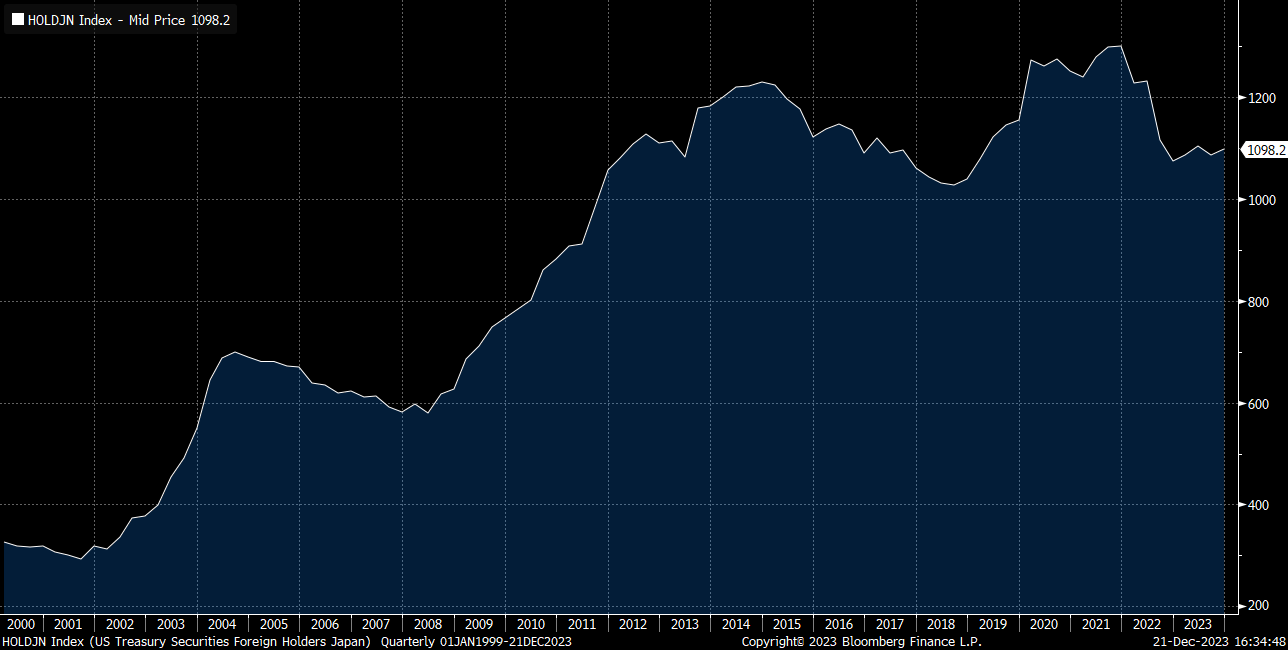
Many of the institutions buying US treasuries are pension funds which makes sense as the older demographic has acquired more savings. The chart below shows pension fund assets and Japan’s holdings of US treasuries:
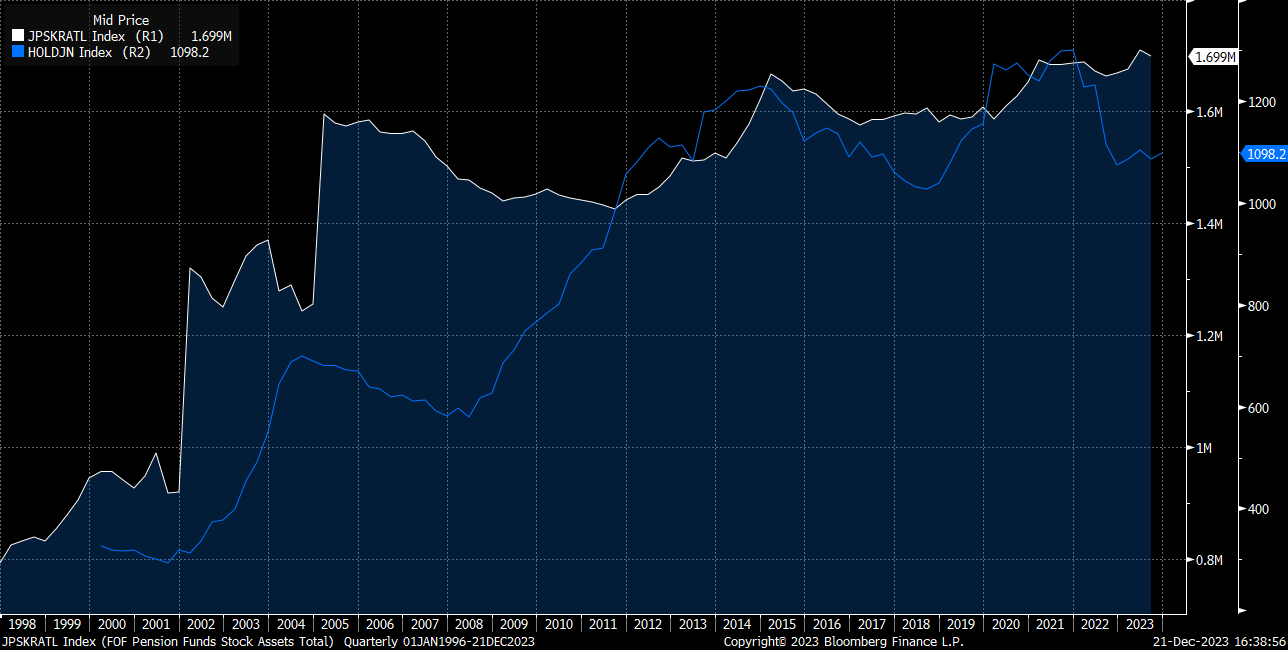
Given the significant exposure to US treasuries by Japanese pension funds and banks, there is a high degree of correlation between the two. The chart below is the TOPIX bank index and the US 10-year interest rate:
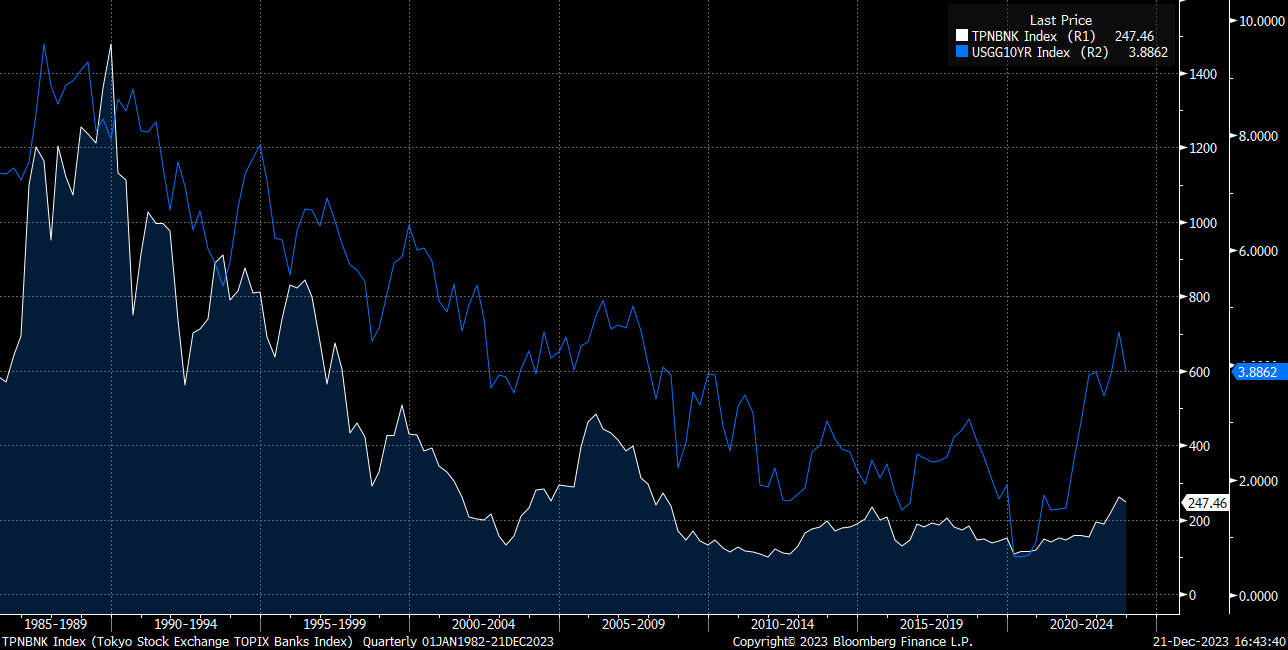
The main thing you need to know about Japanese asset markets and the Yen is that they are not only moving off the cyclical flow differentials but that their balance sheets have significant long exposure to the US treasury market.
Additional Technical Reasons Connected To Japan’s UST Holdings:
Foreign Exchange Reserves: As a major exporter, Japan accumulates large foreign exchange reserves. These reserves are primarily held in U.S. dollars, given its status as the world's primary reserve currency. U.S. Treasuries, being safe, liquid, and denominated in dollars, are a natural choice for investing these reserves.
Trade Surplus with the U.S.: Japan has historically run trade surpluses with the United States. When Japanese companies repatriate their earnings from the U.S., this influx of dollars is often invested in U.S. government securities, which helps maintain the value of these reserves.
Risk Management and Diversification: U.S. Treasuries are considered one of the safest investments in the world due to the creditworthiness of the United States. For Japan, holding U.S. Treasuries is a way to diversify its portfolio and manage risks, particularly those associated with the fluctuations in the global economy and currency markets.
Economic Stability and Low Yields in Japan: Japan's own interest rates have been extremely low for decades, often hovering near or below zero. This makes the relatively higher yield of U.S. Treasuries, despite being low by historical standards, more attractive for Japanese investors, including the government.
Corporate Profits:
The final thing to cover before moving to the financial markets section of this primer is corporate profits.
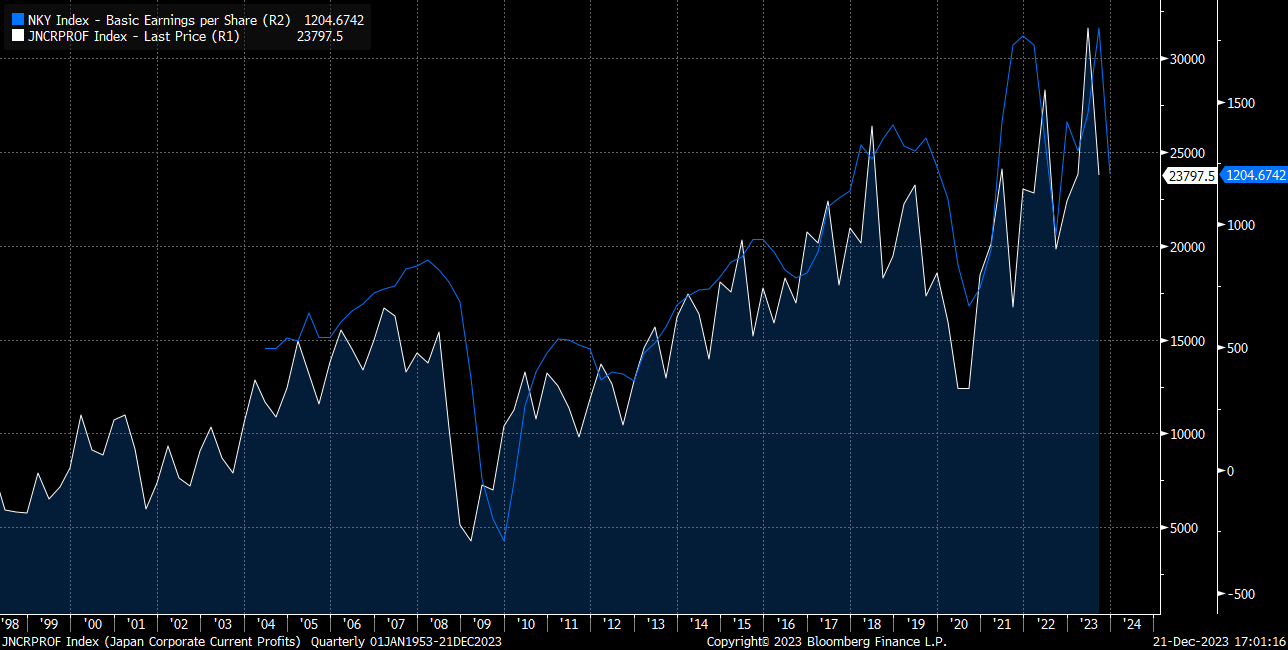
GDP is distributed through various sectors of any economy and the flip side of GDP is GNI. One of the main line items in GNI is corporate profits. Corporate profits connect to the bottom line earnings in the financials of publically traded companies.
Here are Japanese corporate profits and the EPS of the Nikkei:
You can begin to break down corporate profits by sector and then connect them to equity sector earnings in financial markets:
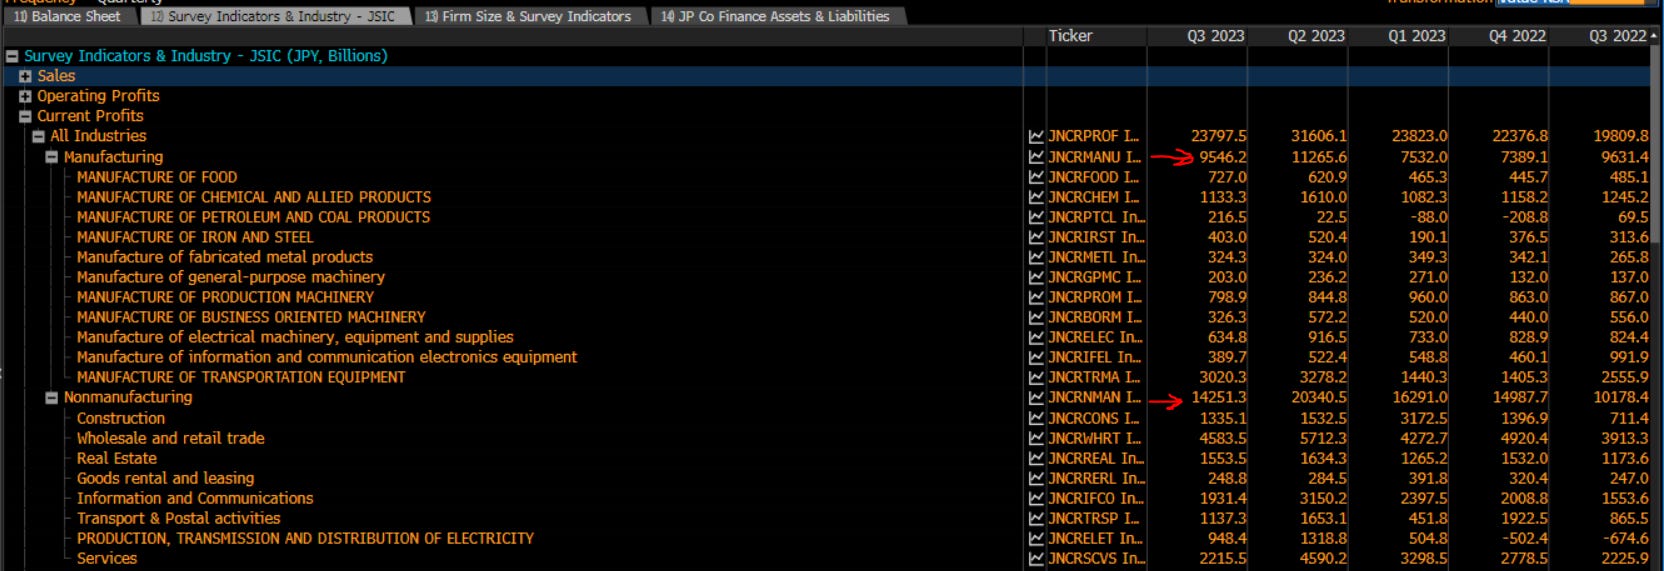
All of this data is publically available via the CME tool which will provide you with all sources if you want to pull the raw data and model it.
Summary: We have covered a lot so far! If you feel like it’s a lot to take in then that’s good. Growth occurs when you are being stretched the most. The main idea you need to take away from my points above is that there is a context for Japanese financial markets. Japan has a unique position within the global system from a geographic, demographic, and balance sheet perspective. This begins to frame the WHY behind the growth, inflation, and liquidity conditions in Japan. Furthermore, it will provide significant visibility into how you analyze financial assets in Japan. Nothing trades in a silo and if you know what is happening in Japanese markets, you will have a clearer picture of what is happening in the rest of the world.
Financial Markets: Stocks, Bonds, and the Yen:
The way you break down financial assets in Japan is very similar to how you break down assets in any country. However, you need to remember that every market is unique and there will always be different variables you need to account for. On a fundamental basis, the causal mechanics are the same. If you understand the causal mechanics of what drives asset markets in general (and not simply a siloed experience from the US), you will pick it up very fast.
There is one main idea that you will begin to see: Global markets are ALL connected. The same people who trade US assets also trade Japanese assets. The PM managing risk in the Magnificent 7 stocks could be a Japanese hedge fund manager balancing risk in their corporate bond book that is denominated in the Yen. Just because you might trade assets in a silo doesn’t mean that is how the world works.
Equities:
There are two major equity indices in Japan: The Nikkei and TOPIX
Nikkei 225: Also known as the Nikkei Stock Average, the Nikkei 225 is one of the most prominent stock indices in Japan. It tracks 225 top-rated companies listed on the Tokyo Stock Exchange (TSE). The index is price-weighted, similar to the Dow Jones Industrial Average in the United States, and includes leading companies from various industries.
TOPIX (Tokyo Stock Price Index): The TOPIX covers all domestic companies of the first section of the Tokyo Stock Exchange, which makes it a broader indicator than the Nikkei 225. It's a market capitalization-weighted index, including over 2,000 companies, and reflects the overall performance of the TSE's First Section.
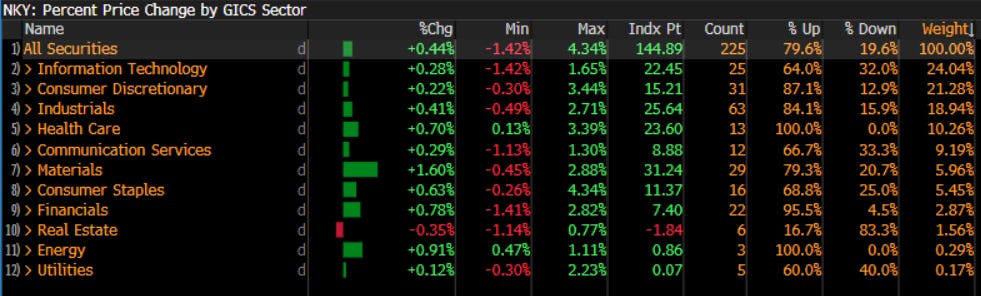
The sector weighting for the Nikkei is similar to the US:
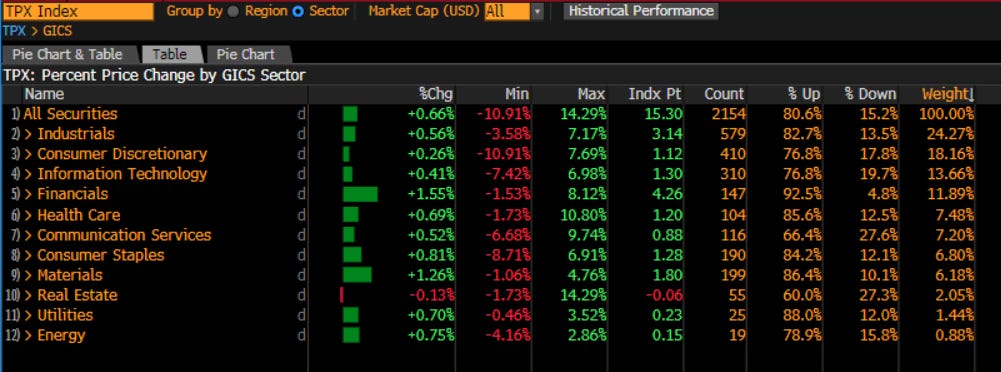
The TOPIX has a higher allocation to industrials (watching the Nikkei/TOPIX ratio is important):
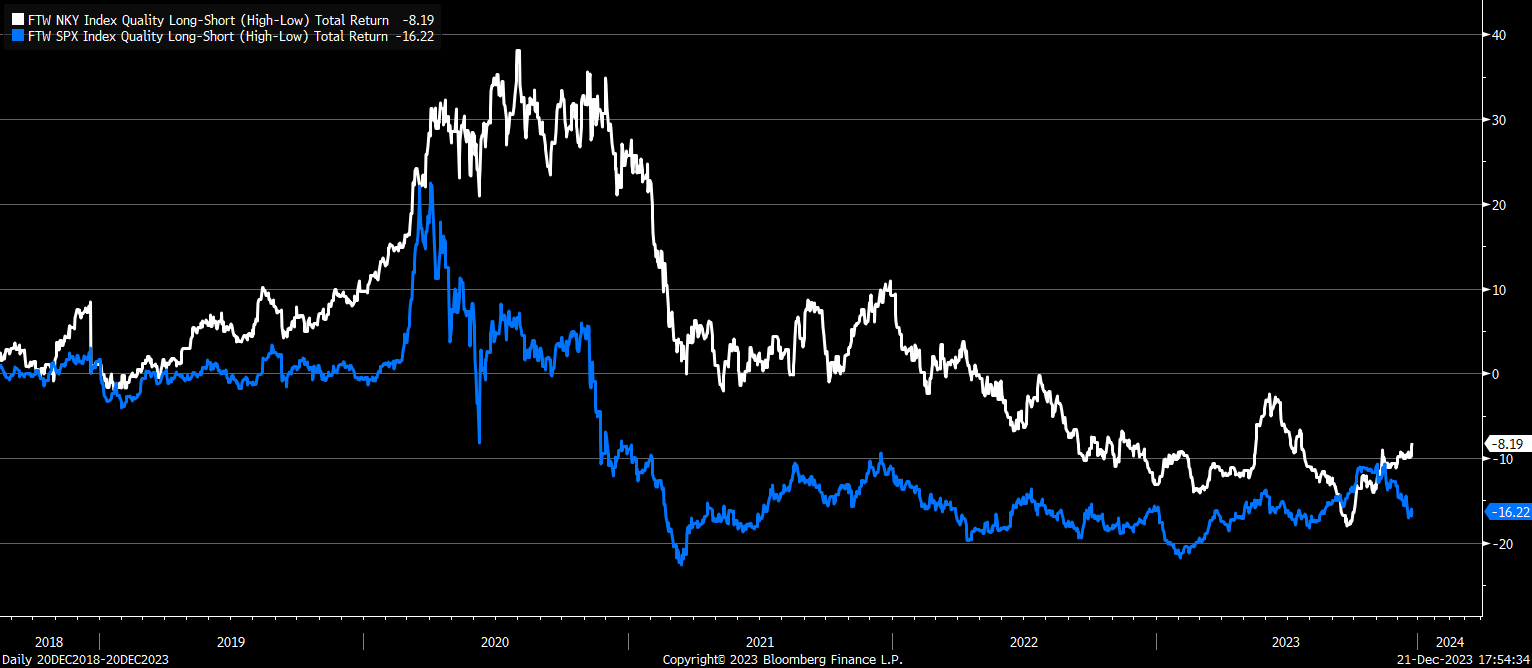
When we look at the quality factor between the Nikkei and SPX, there is a clear connection:
This is true of value vs growth factor as well:
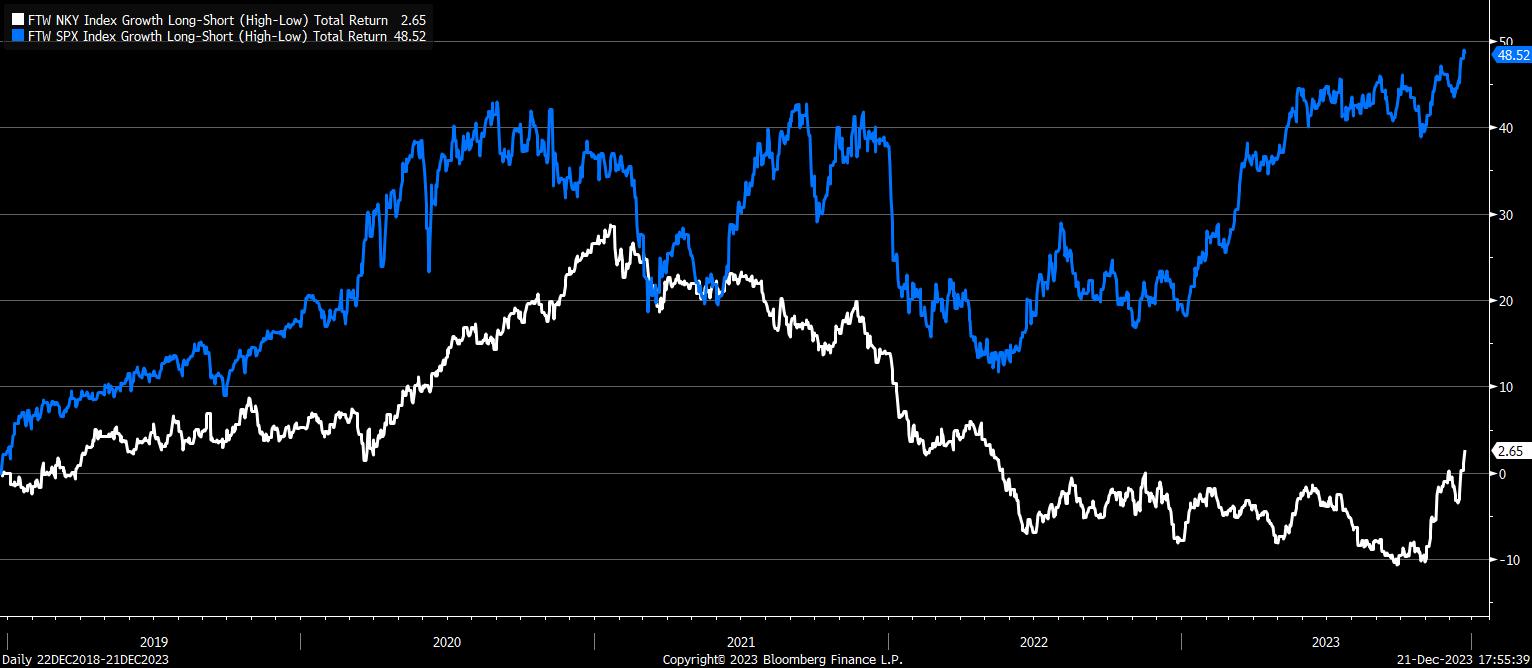
This begins to show you that you can trade the indices, sectors, and factors of different countries against each other. This allows you to further isolate the causality of a trade or have clearer signals for the trades you are already running.
As noted earlier, you want to closely monitor Japanese banks due to their correlation with US interest rates. If this correlation begins to diverge then you know how to find out WHY it might be diverging by analyzing the balance sheets and exposure of these banks and Japan as a whole.
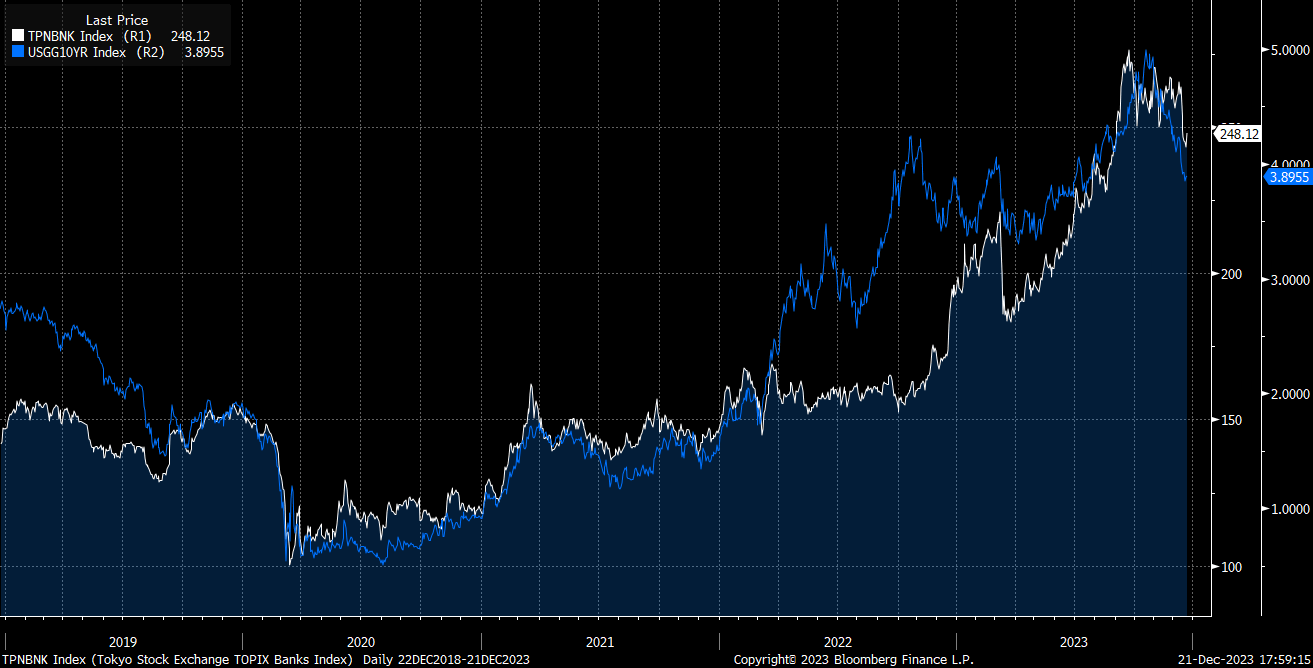
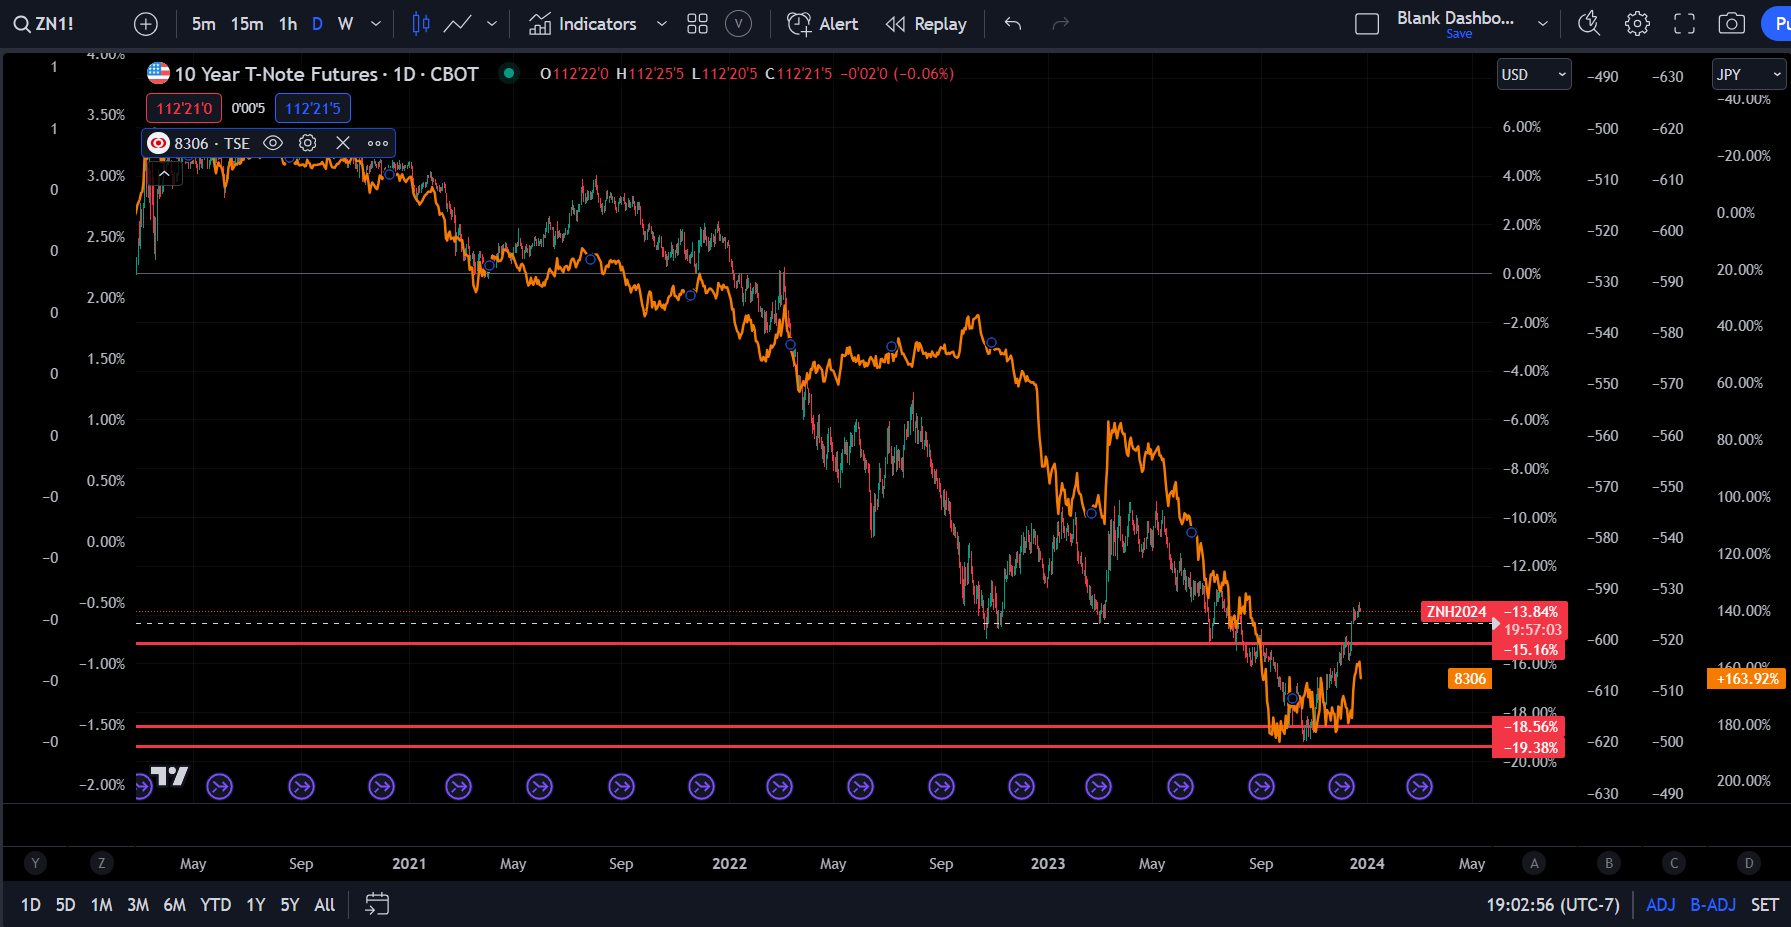
For example, here is Mitsubishi financial (inverted) overlayed against ZN:
Here are all the banks in the Nikkei and TOPIX:
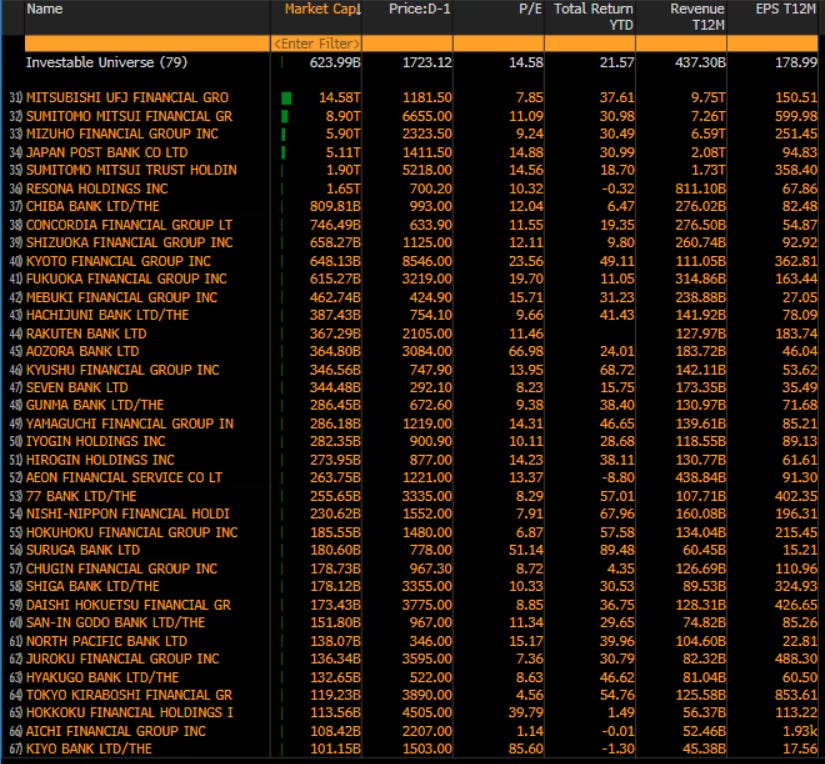
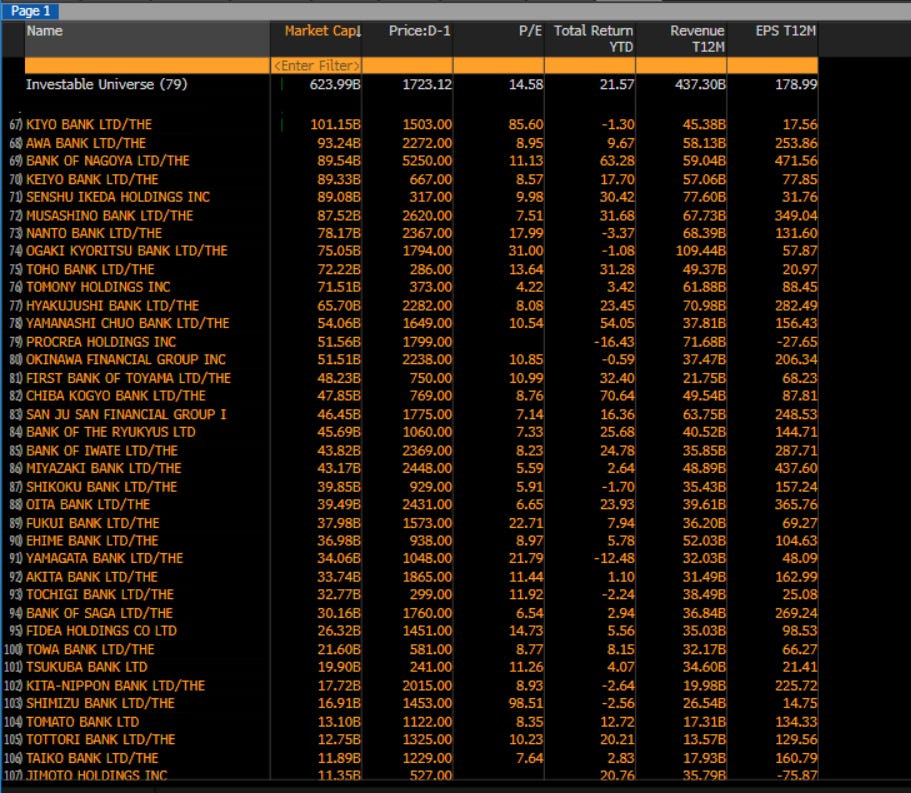

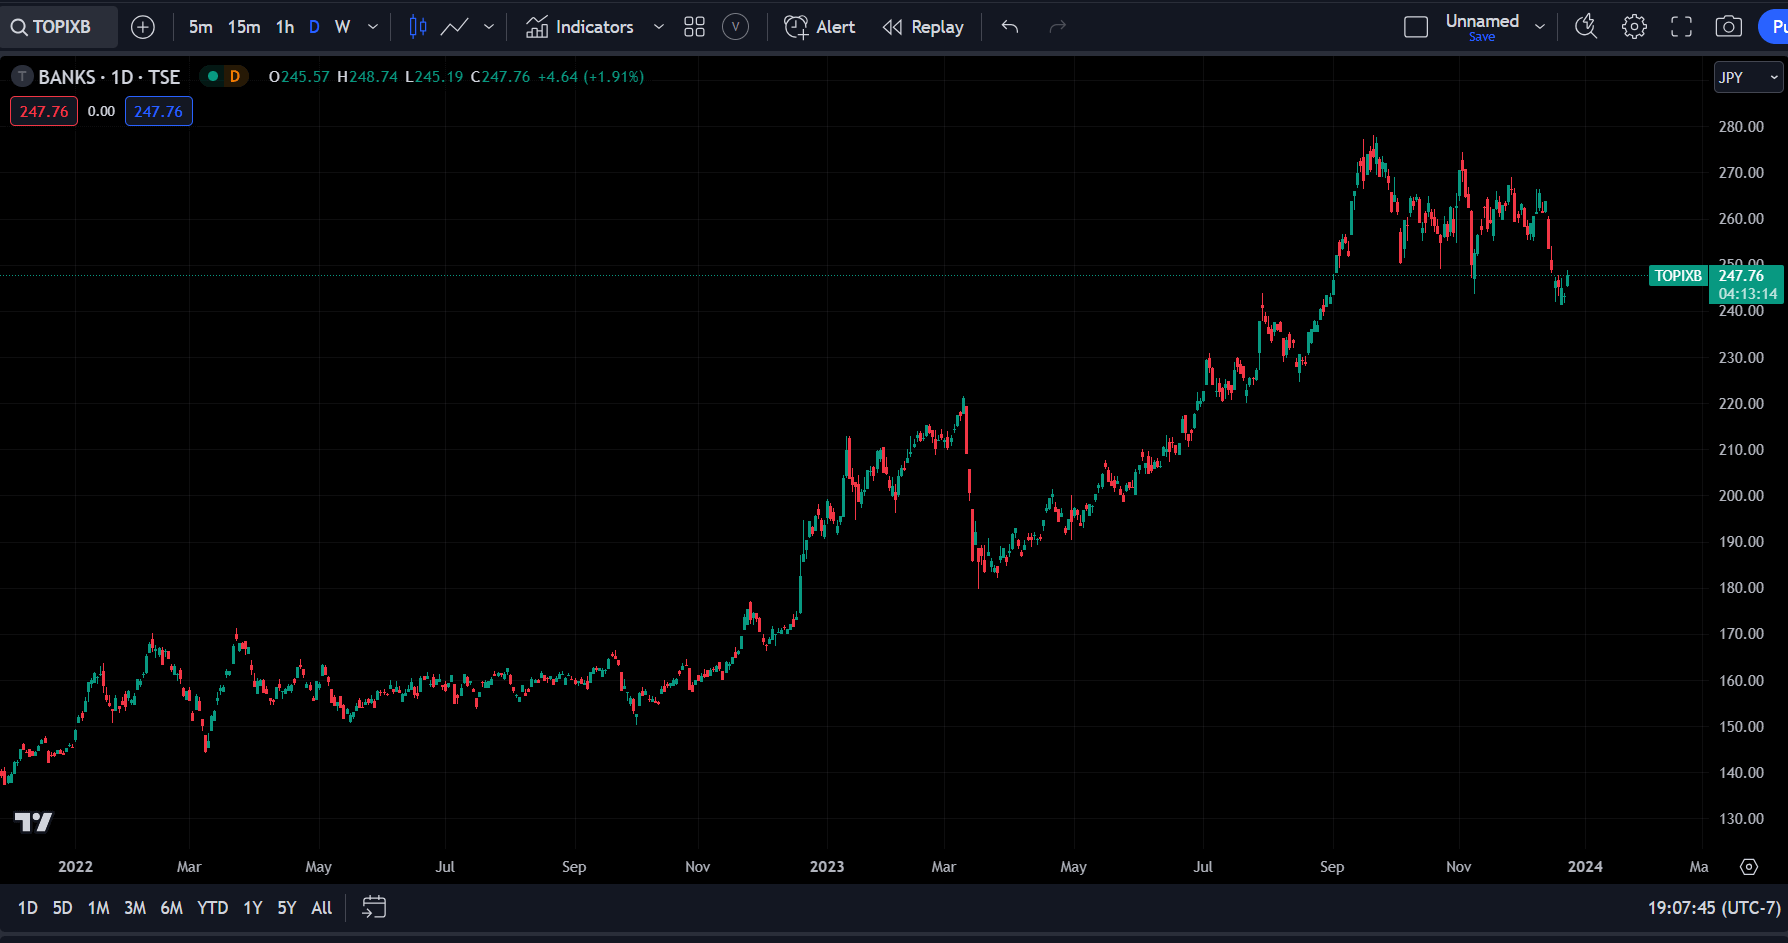
If you search any of these names in Tradingview or your broker, they will come up. You can also monitor the TOPIX bank index as well:
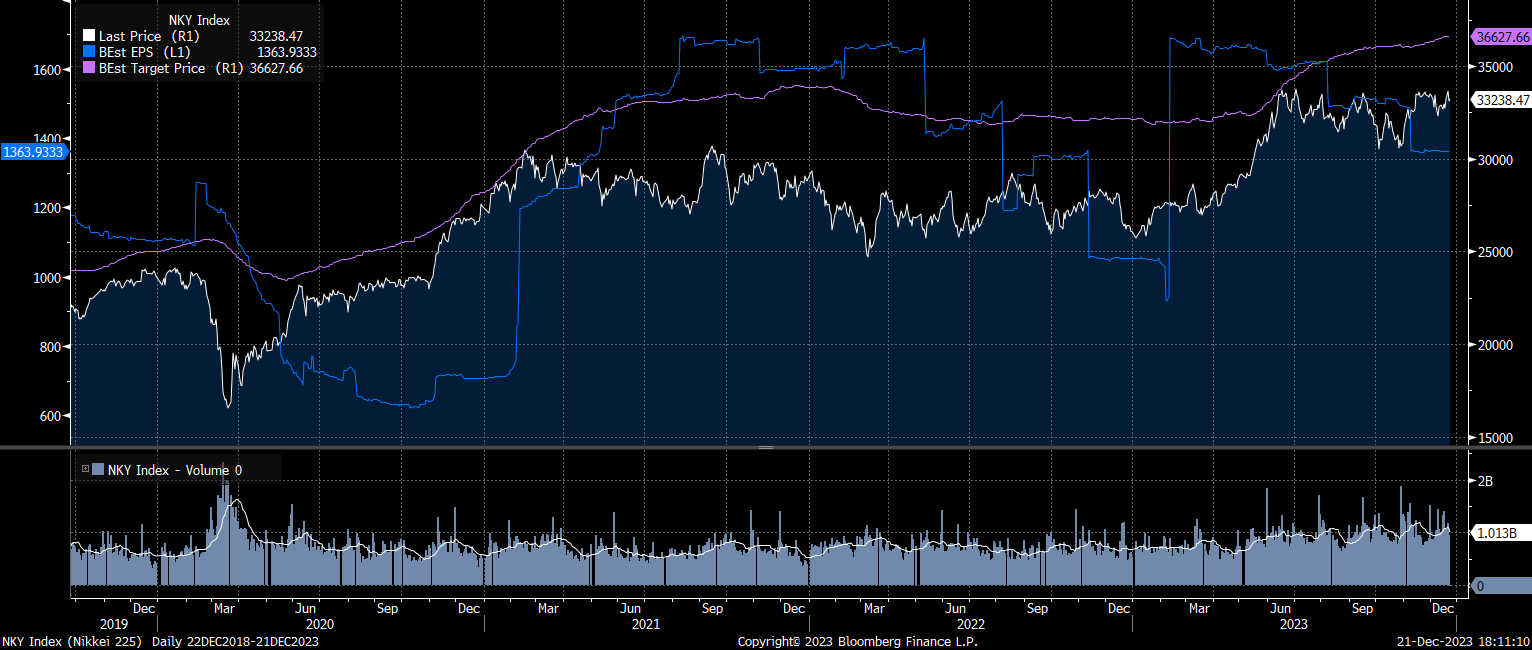
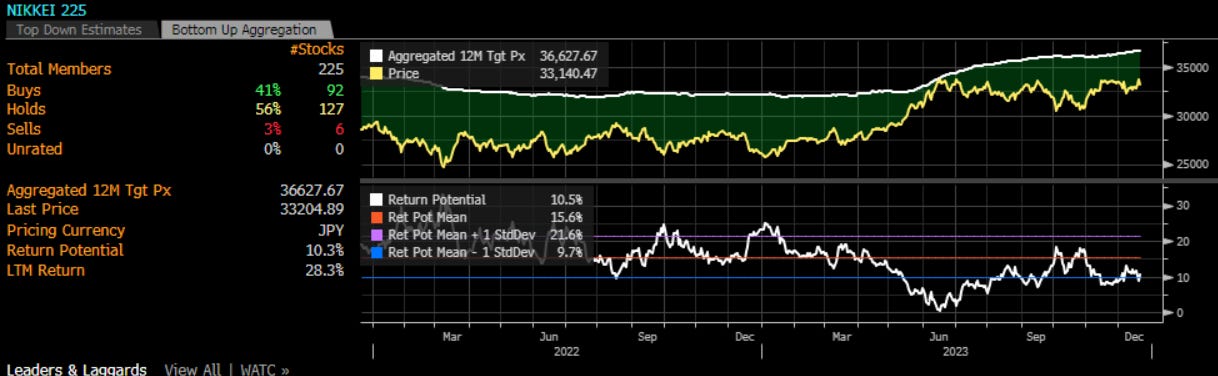
Understanding this connection to US bonds will help you conduct attribution analysis for equities. Nikkei earnings expectations (blue) and analysts’ price targets (purple) will move as underlying fundamentals shift.
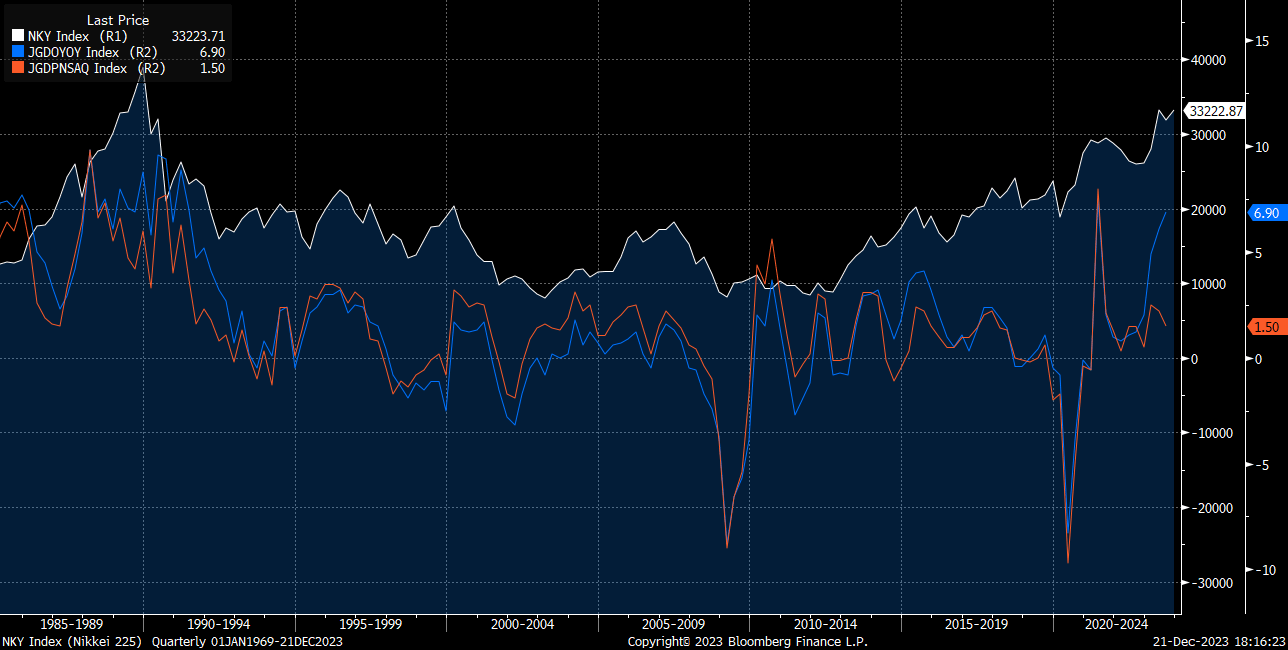
Watching the conditions and divergences in both nominal and real GDP is key for the Nikkei. We are currently seeing a significant deviation in nominal GDP:
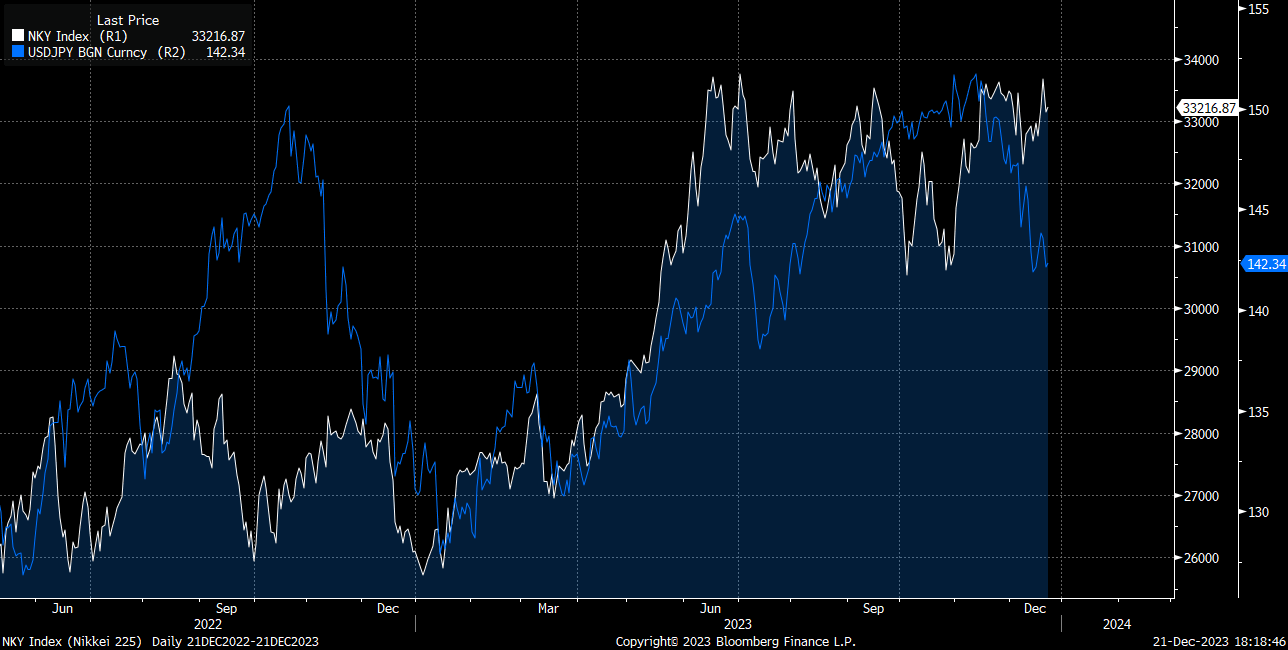
This occurred as the BoJ implemented yield curve control which devalued the Yen and boosted the Nikkei’s valuation function:
Watching the respective economic data and its connection to sector and factor flows in Japanese markets will be critical if you are trading US bonds.
If you understand this context, then the bond and FX market will begin to make a lot more sense.
Bonds:
Since the BoJ is in a constant process of buying JGBs and implementing YCC, the Yen has been functioning as a release valve for risk when the BoJ intervenes in the bond market.
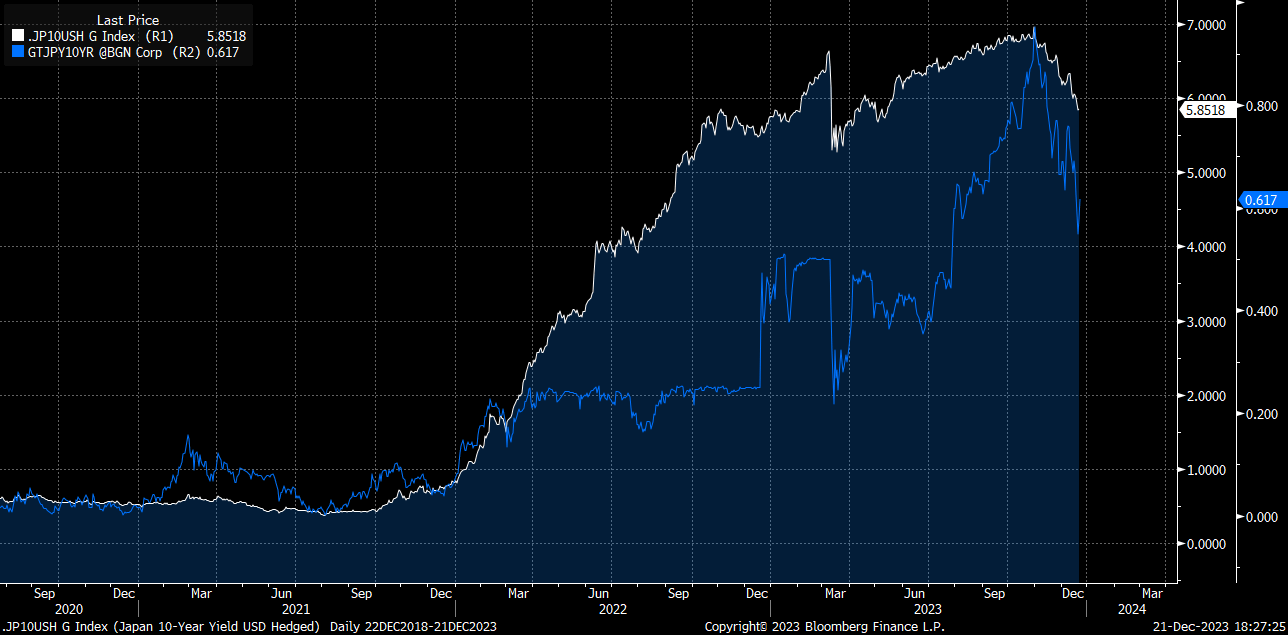
Here is a chart of 10-year nominal JGB yields (blue) with the 10-year JGB yields hedged with US dollars. You can notice the dramatic difference between the price action:
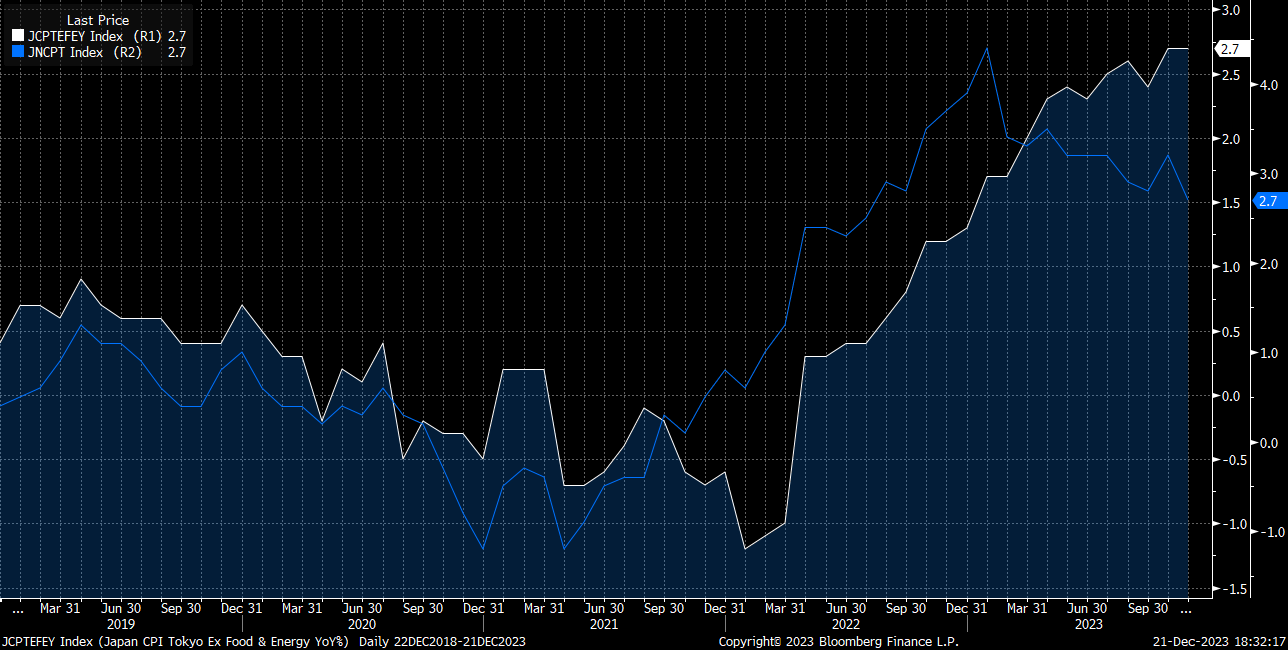
Within the current context of BoJ action, you need to determine where nominal yields are going. This is based on inflation and the BoJ. Here is a chart of headline (blue) and core (white) inflation in Japan:
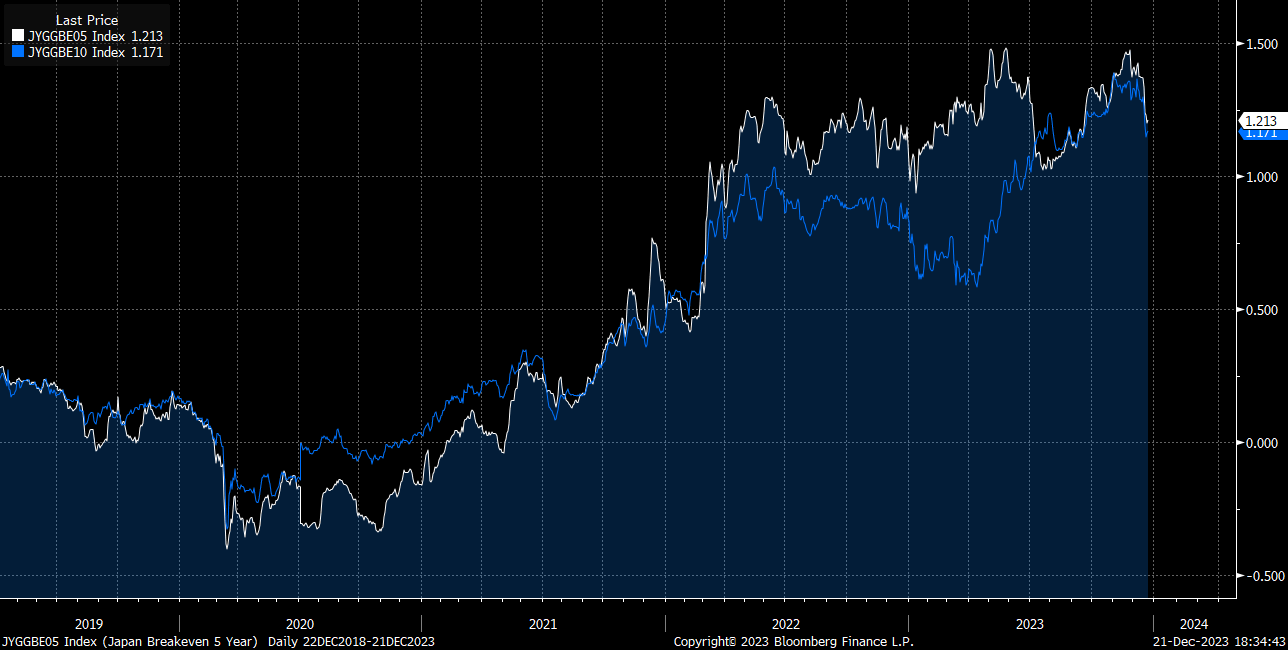
Breakevens are still elevated but are facing resistance:
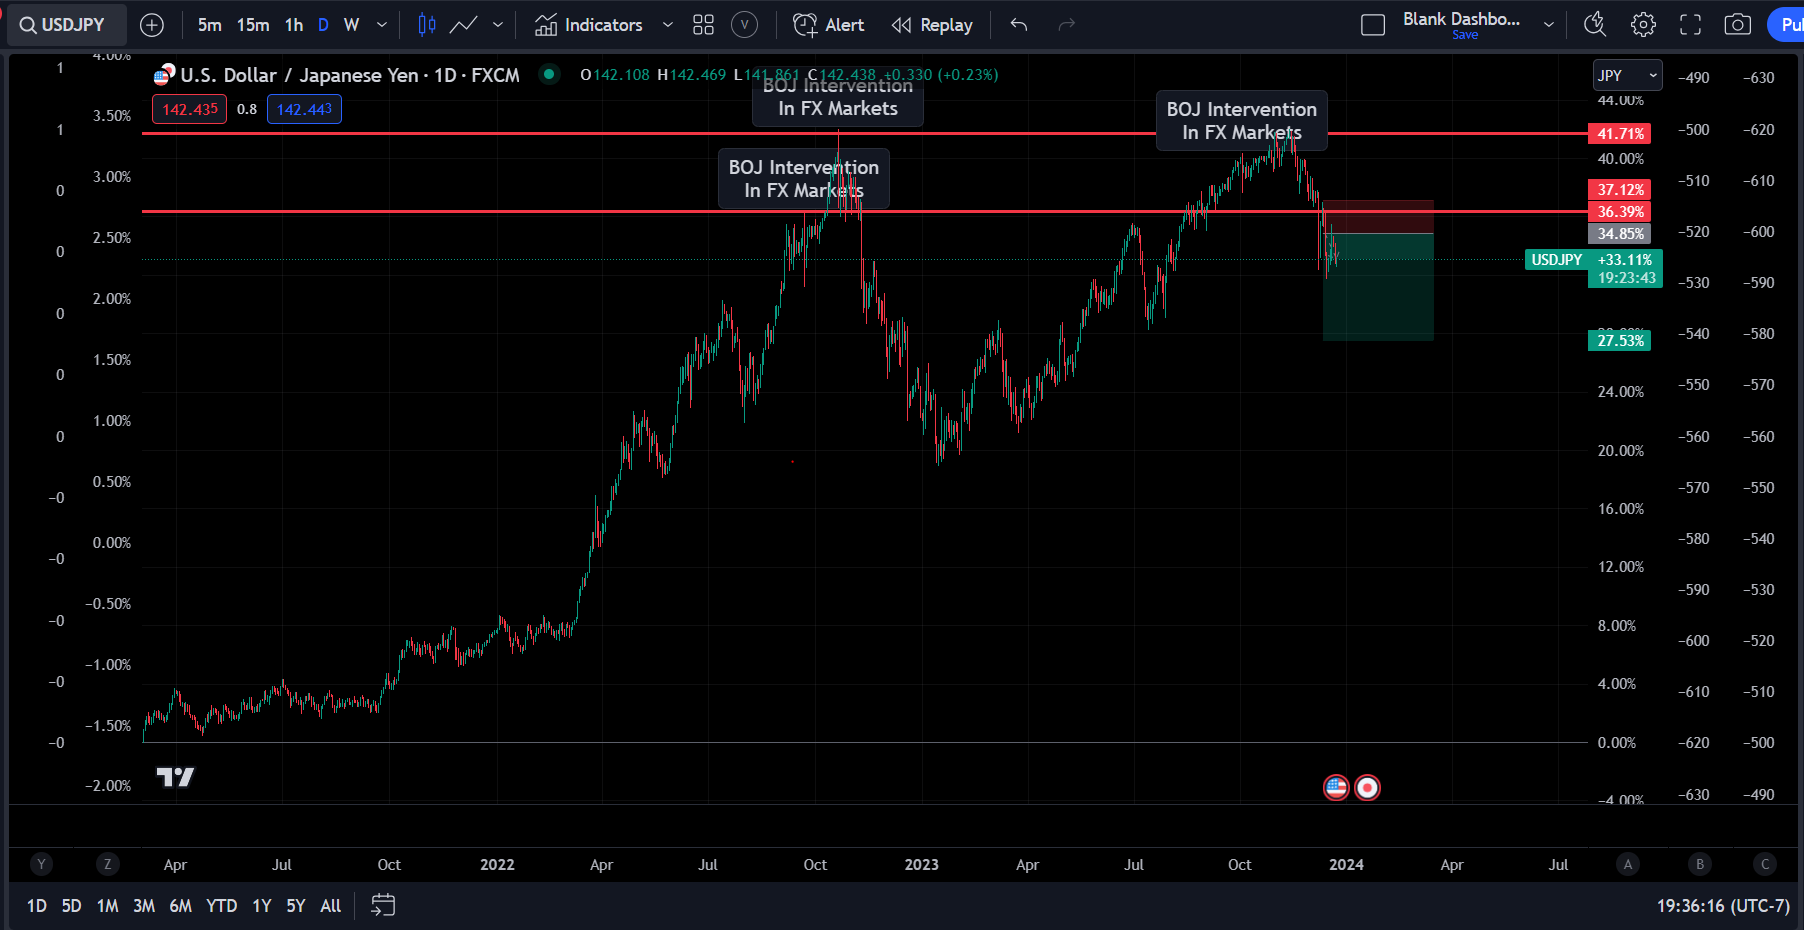
The key thing to distinguish is whether the BoJ is intervening in the bond market or FX market. The BoJ has provided guidance in its YCC target and shown that it will intervene multiple times when the Yen nears highs in this cycle:
FX:
This is where understanding the impossible trinity from the FX primer is key!
The Research HUB: FX Primer, Pt 1

Hey everyone, This article will serve as Part 1 of a 5-part series, acting as an FX primer. For those interested, I've previously written primers on both the S&P500 (link) and the bond market (link). If you have spent any time at all in FX markets, you know that sometimes a move makes total sense, and then the next move makes zero sense. On top of that, FX isn’t like equities where it just always (theoretically ;) ) goes up and to the right!
The Impossible Trinity, also known as the Trilemma, is a fundamental concept in international economics. It posits that it's impossible for a country to have all three of the following at the same time:
A fixed foreign exchange rate.
Free capital movement (absence of capital controls).
An independent monetary policy.
In other words, a country can achieve only two of the three objectives at once. Let's delve deeper into each of these components and the implications of the trilemma:
Fixed Foreign Exchange Rate: This is when a country pegs its currency to another currency (like the U.S. dollar or the Euro) or to a basket of currencies. This provides stability in trade and capital flows but can be challenging to maintain.
Free Capital Movement: This means there are no restrictions on the movement of capital in and out of the country. It's a hallmark of open, liberalized economies and is essential for deep and liquid financial markets.
Independent Monetary Policy: This allows a country to set its own interest rates and implement other monetary policies based on its economic conditions, such as controlling inflation or combating unemployment.
In this current regime, the actions of the BoJ directly influence either nominal rates via YCC or the Yen via FX intervention. Depending on where growth and inflation are when the BoJ implements one of these actions will determine the impact on JGBs, the Yen, and the Nikkei.
Summary: You can begin to see how the financial assets in Japanese markets are directly connected with the bigger picture context and fit into the global system of capital flows. The actions of the BoJ in either the JGB or FX market directly impact the Japanese market and global asset markets.
History of growth, inflation, and liquidity on a structural and cyclical basis:
We have addressed a lot of the fundamentals for Japanese markets but now we need to address the elephant in the room. What in the world happened during the late 80s and early 90s to Japanese equity markets?
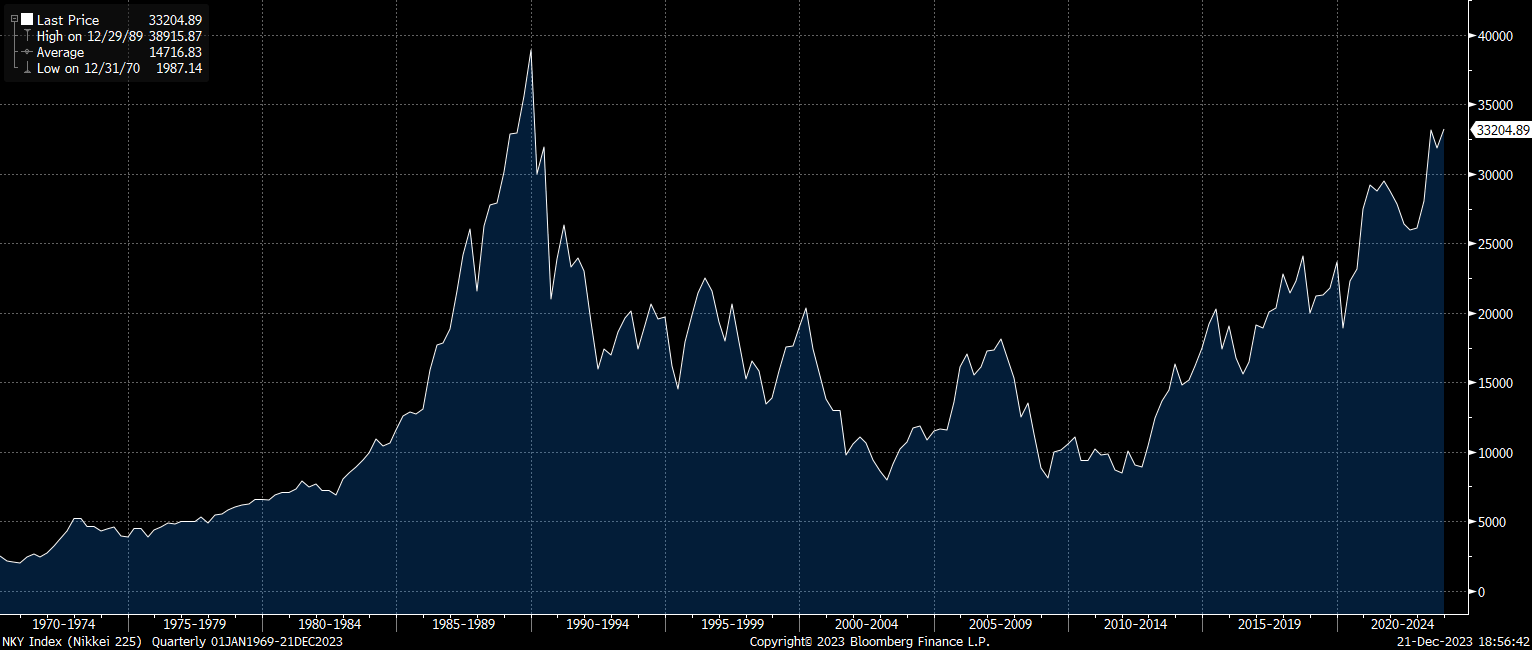
The Japanese Asset Bubble: A Technical Breakdown
The Japanese asset price bubble of the late 1980s was a period of extraordinary speculation and investment in real estate and stock markets, fueled significantly by the actions of the Japanese government and the Bank of Japan (BoJ). The government's role was primarily in its regulatory policies and encouragement of industrial growth and investment. Their policies promoted a pro-business environment, which, coupled with lax credit regulations, allowed for easy access to loans and credit for both corporations and individuals. This environment led to an overinvestment in real estate and stocks, driving prices to unprecedented heights. The BoJ's role was crucial, as their monetary policy during this period was characterized by low-interest rates. This policy was initially intended to counteract the yen's rapid appreciation following the Plaza Accord of 1985, but it inadvertently fueled speculation in the financial markets.
Credit creation played a pivotal role in inflating the bubble. Japanese banks, flush with funds due to a high domestic savings rate, engaged in aggressive lending practices. Much of this lending was collateralized against real estate, which as a result of the bubble, had artificially inflated values. This excessive lending led to a cycle where increased demand for real estate drove prices even higher, further encouraging both borrowing and lending. Consumers and corporations alike were caught in this euphoria; the widespread belief that land prices would only continue to rise led to speculative buying and investment. During this period, examples of exorbitant real estate prices were commonplace. In Tokyo, prime real estate could cost as much as several million dollars for a square meter, and in certain instances, the Imperial Palace in Tokyo was rumored to be worth more than the entire state of California, highlighting the surreal level of property valuation.
The bubble burst in the early 1990s when the BoJ, concerned about overheating in the asset markets, started to raise interest rates. This move made borrowing costs higher, leading to a decrease in lending and spending. As a result, asset prices began to fall, leading to a decline in the value of collateral held by banks, which in turn led to a banking crisis due to a large number of non-performing loans. The burst of the bubble ushered in a period known as the "Lost Decade" in Japan, characterized by economic stagnation and deflation. Since then, Japan's economy has experienced a long and challenging process of normalization. The government and the BoJ implemented various reforms to stabilize the financial system, including bailouts of banks and corporations, and structural reforms to improve the resilience of the economy. However, the legacy of the bubble, particularly in the form of persistent deflation and a cautious approach to credit and investment, continues to influence Japan's economic policy and growth trajectory.
Here is a chart of the BoJ policy rate and the Nikkei. You can see the hiking was the needle that popped the bubble:
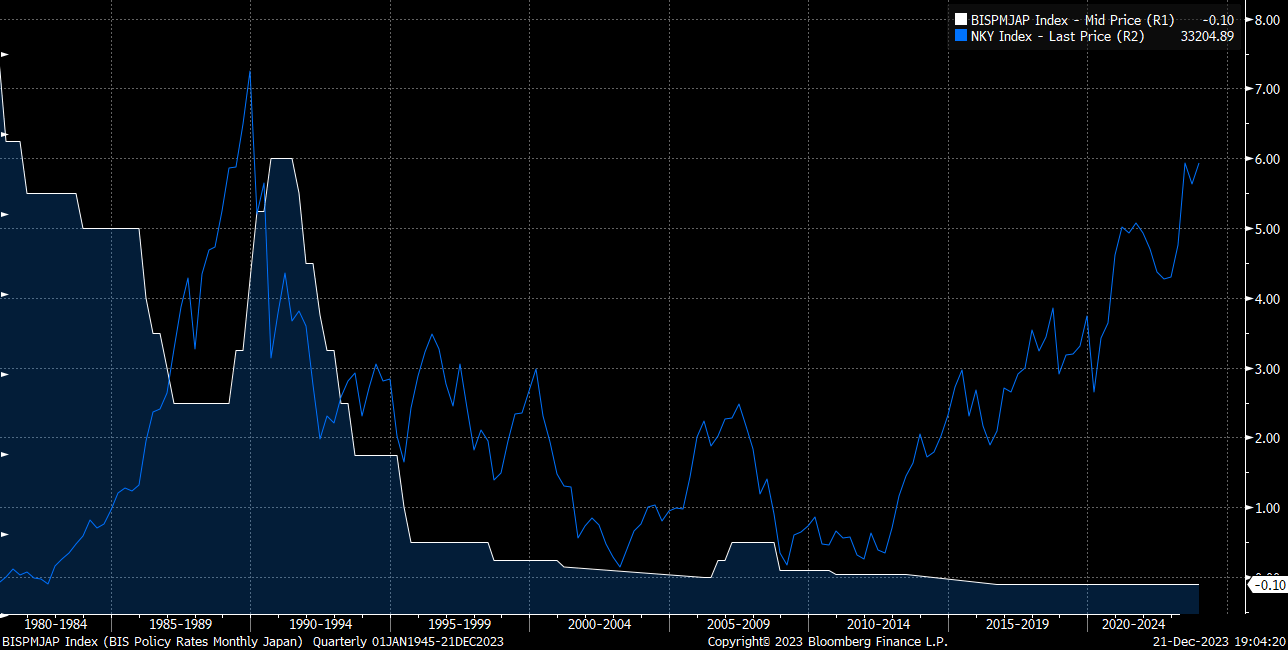
The Japanese asset bubble is one of the primary examples that perma bears bring up for an extended period of deflation and deleveraging. While I don’t believe this is likely to happen, if a deleveraging in the private sector begins at the same time a central bank is hawkish, you want to be short every risk asset possible. This is part of the reason why it’s smart to be in cash during periods of stagflation when a central bank is hiking. First, the risk-free rate is rising and second, if the world begins to fall apart, you’re in cash.
Current growth, inflation, and liquidity regime and its connection to each financial asset:
With all of this as context, let’s dig into the current state of growth, inflation, and liquidity in Japan.
Big picture, we have seen a significant divergence in nominal and real GDP. Inflation is elevated and the BoJ is keeping their discount rate below zero. While the BoJ has been tweaking its yield curve control policy to inject some additional risk premia in markets, it is still unclear if they have “reached their target.” Remember, the majority of global central banks are trying to get inflation DOWN to their target while the BoJ is trying to get inflation UP to their target.
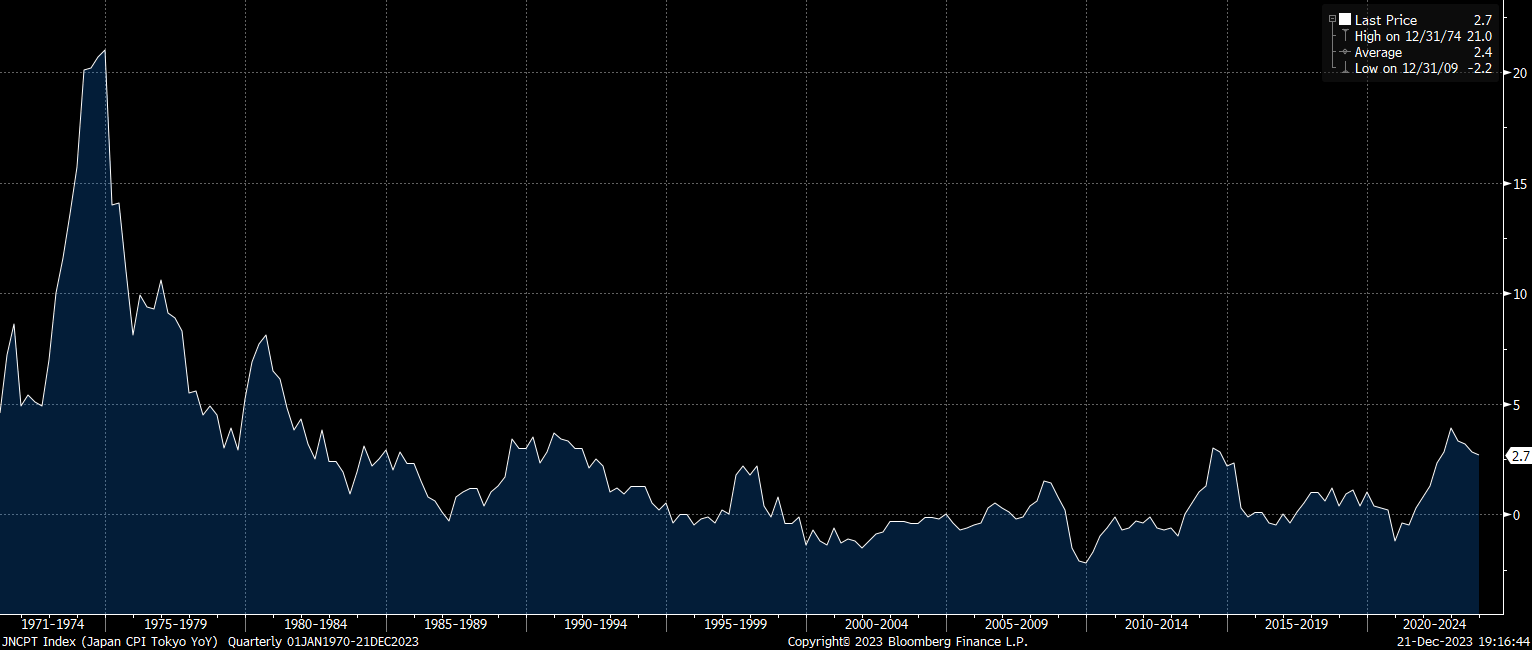
Inflation has always been incredibly low for Japan given its structural situation:
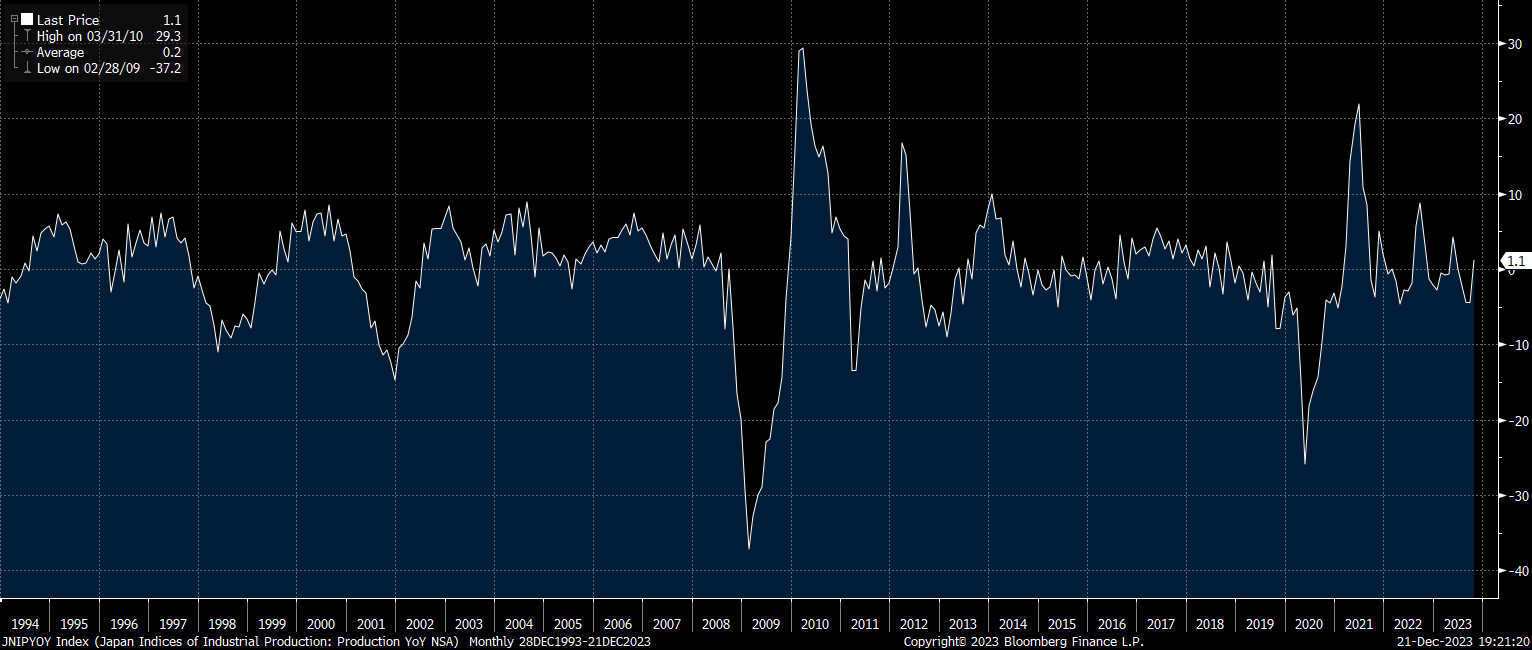
Industrial production is squarely positive:
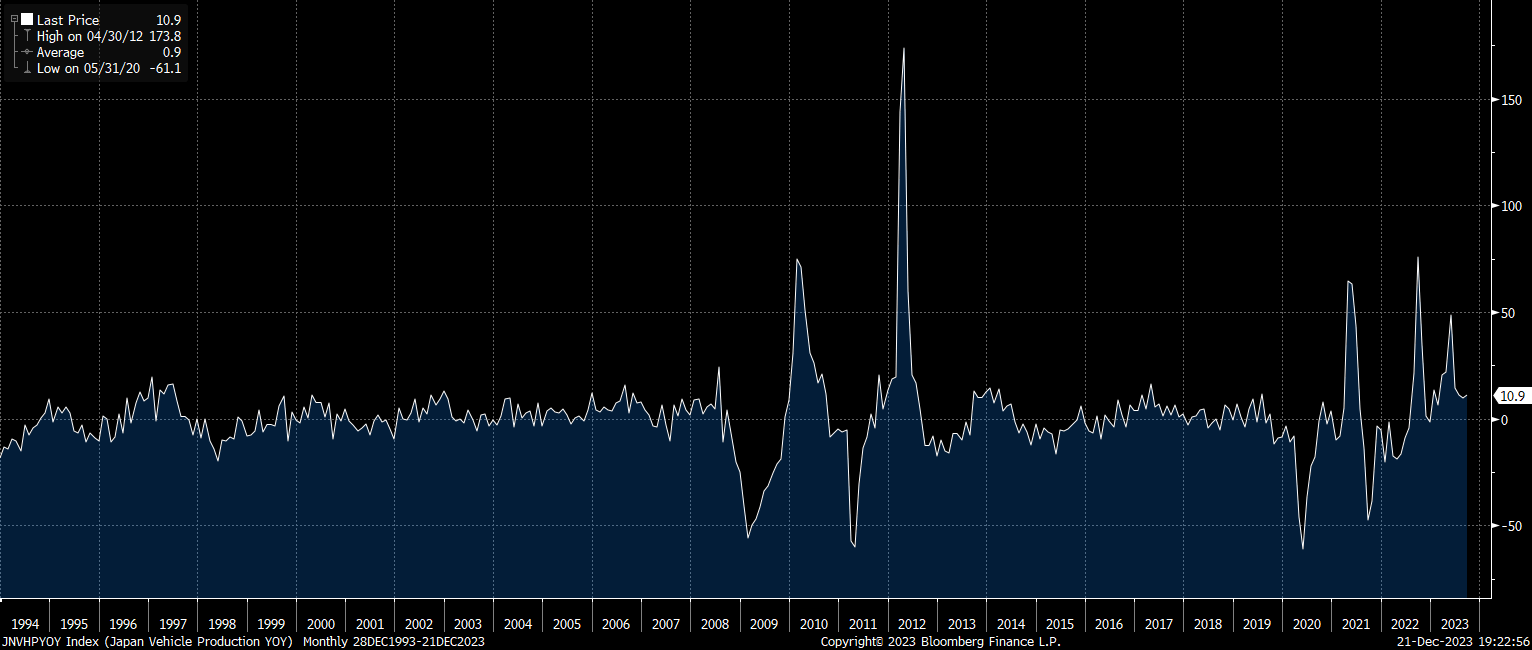
As is vehicle production:
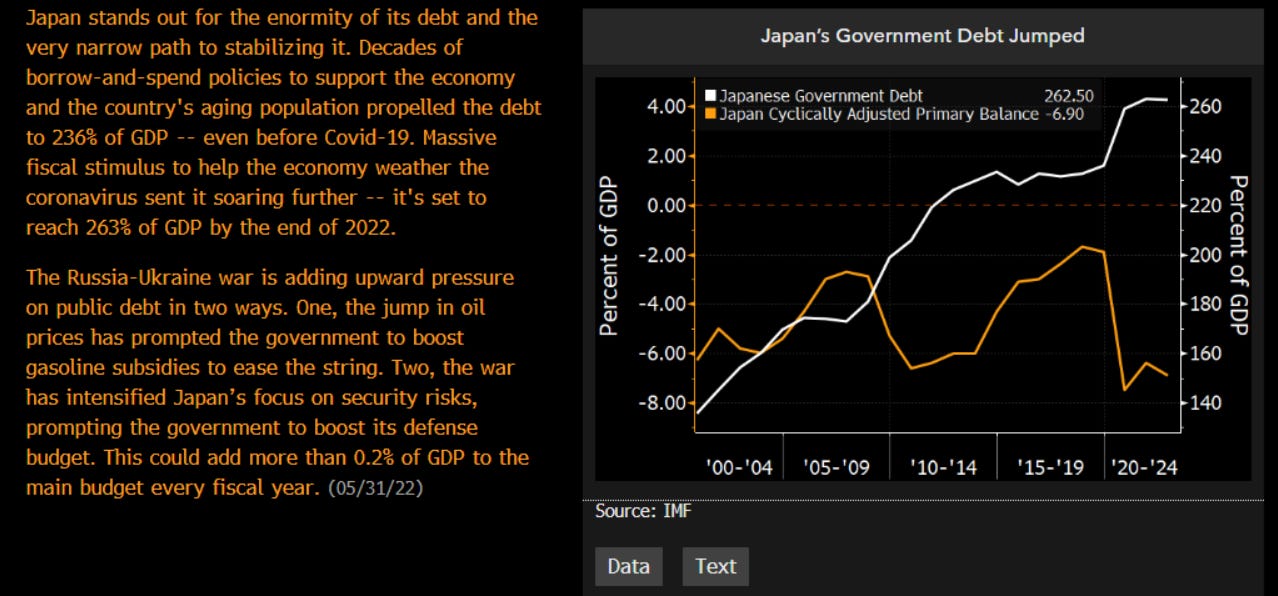
The debt will continue to rise, especially if oil prices are rising:
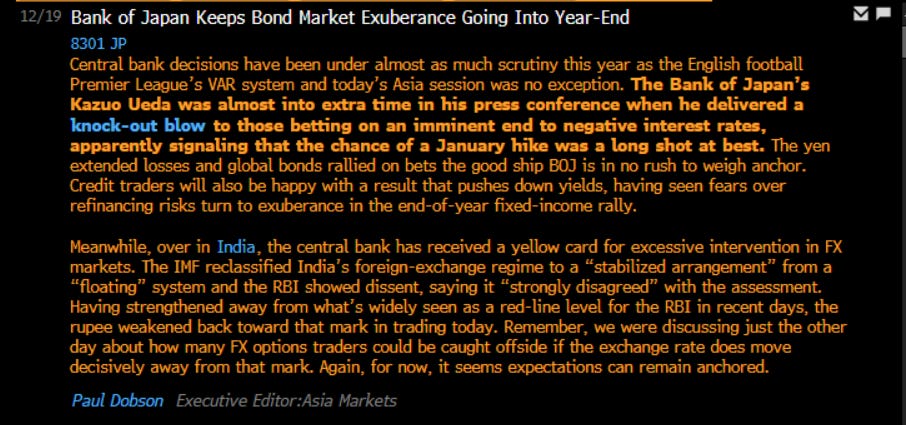
The key thing to note is that Ueda has made some hawkish moves with the change in YCC but he isn’t doing it on the timeline of markets. The market expects Ueda to end the negative interest rate regime which will in turn cause the Yen to strengthen.
This is important to know for the attribution analysis of the Yen. A lot of the Yen strength has been driven by USD weakness and the rally in US bonds.
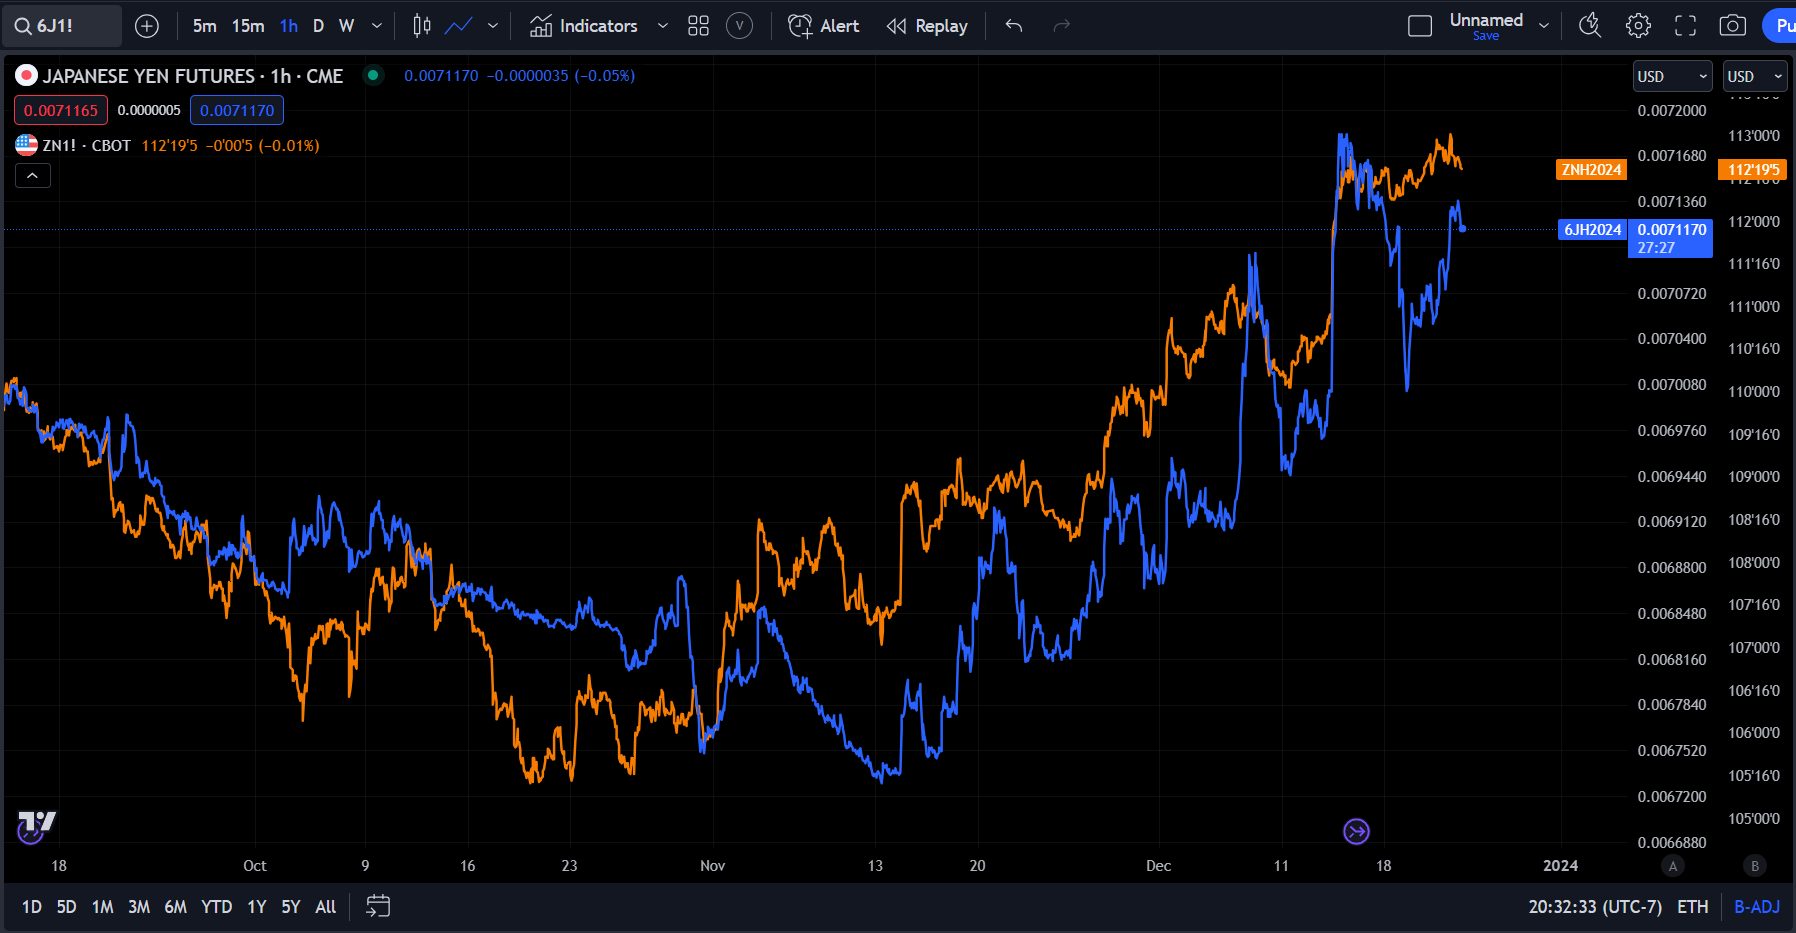
If we begin to see an actual hawkish move by Ueda as US bonds rally, this will put double the pressure because the Yen will be strengthening AND the dollar will be weakening.
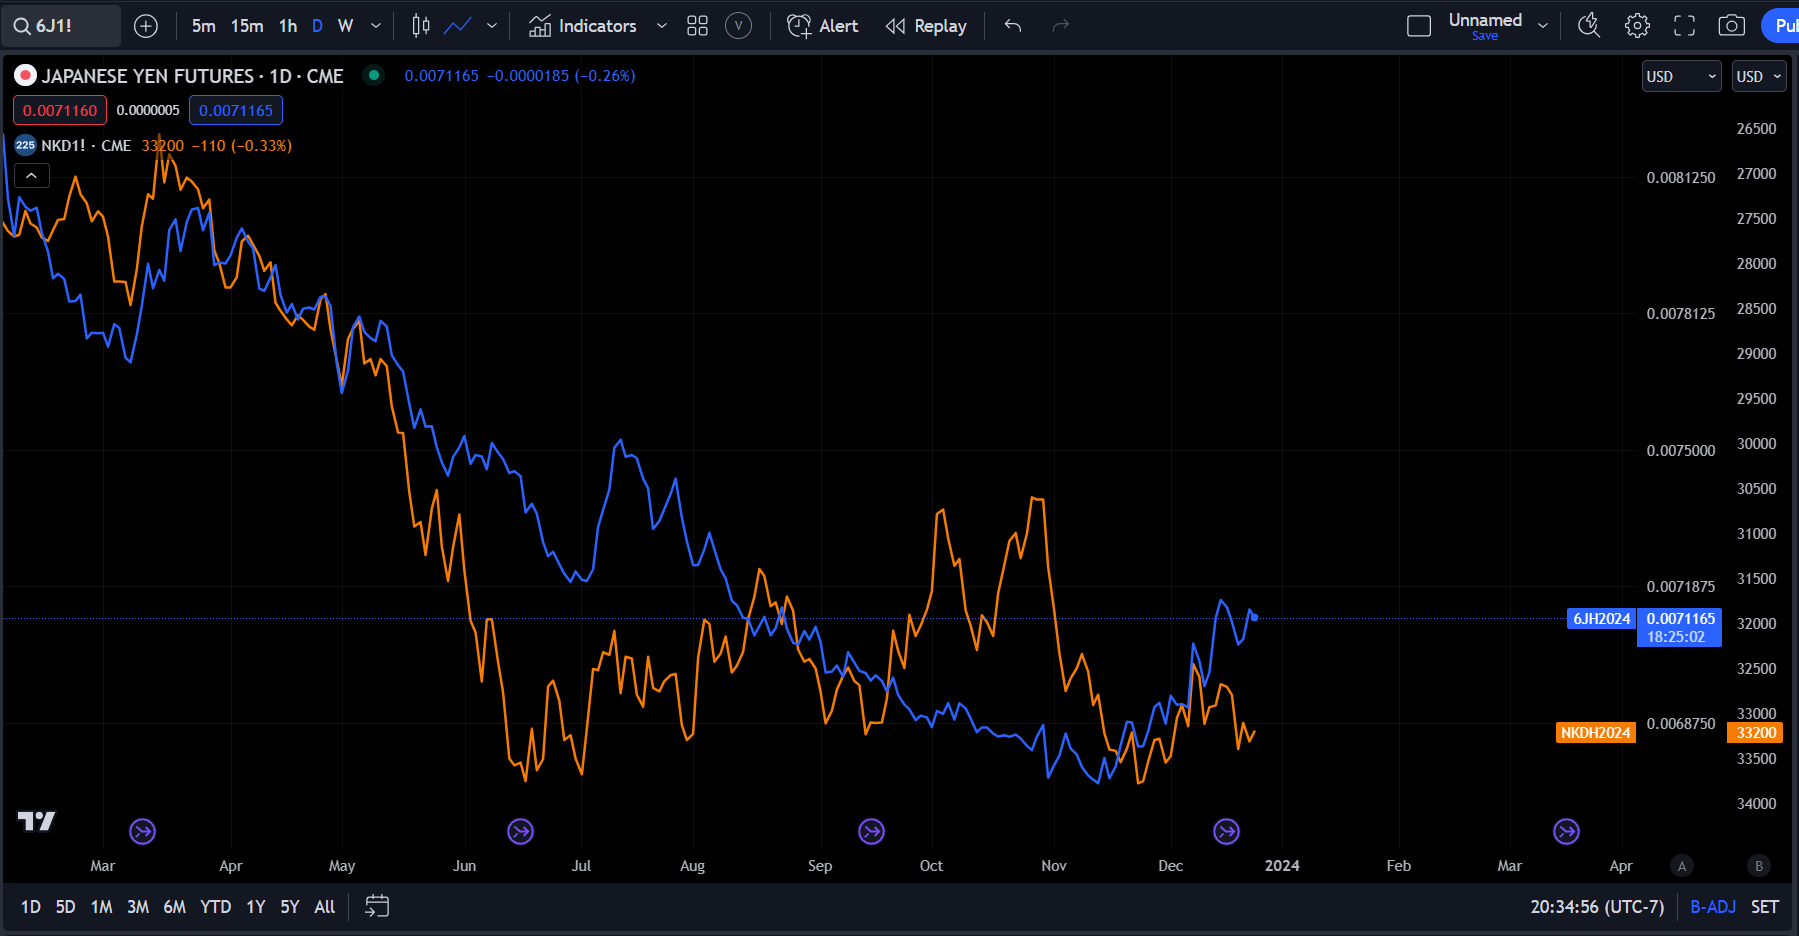
If we see strength in the Yen, this is likely to cause the Nikkei to fall given that the most recent rally was partially driven by Yen weakness:
Watching the Nikkei’s deviation from analyst’s price targets will be important because the more overvalued the Nikkei is, the greater the impact a strong Yen is likely to have.
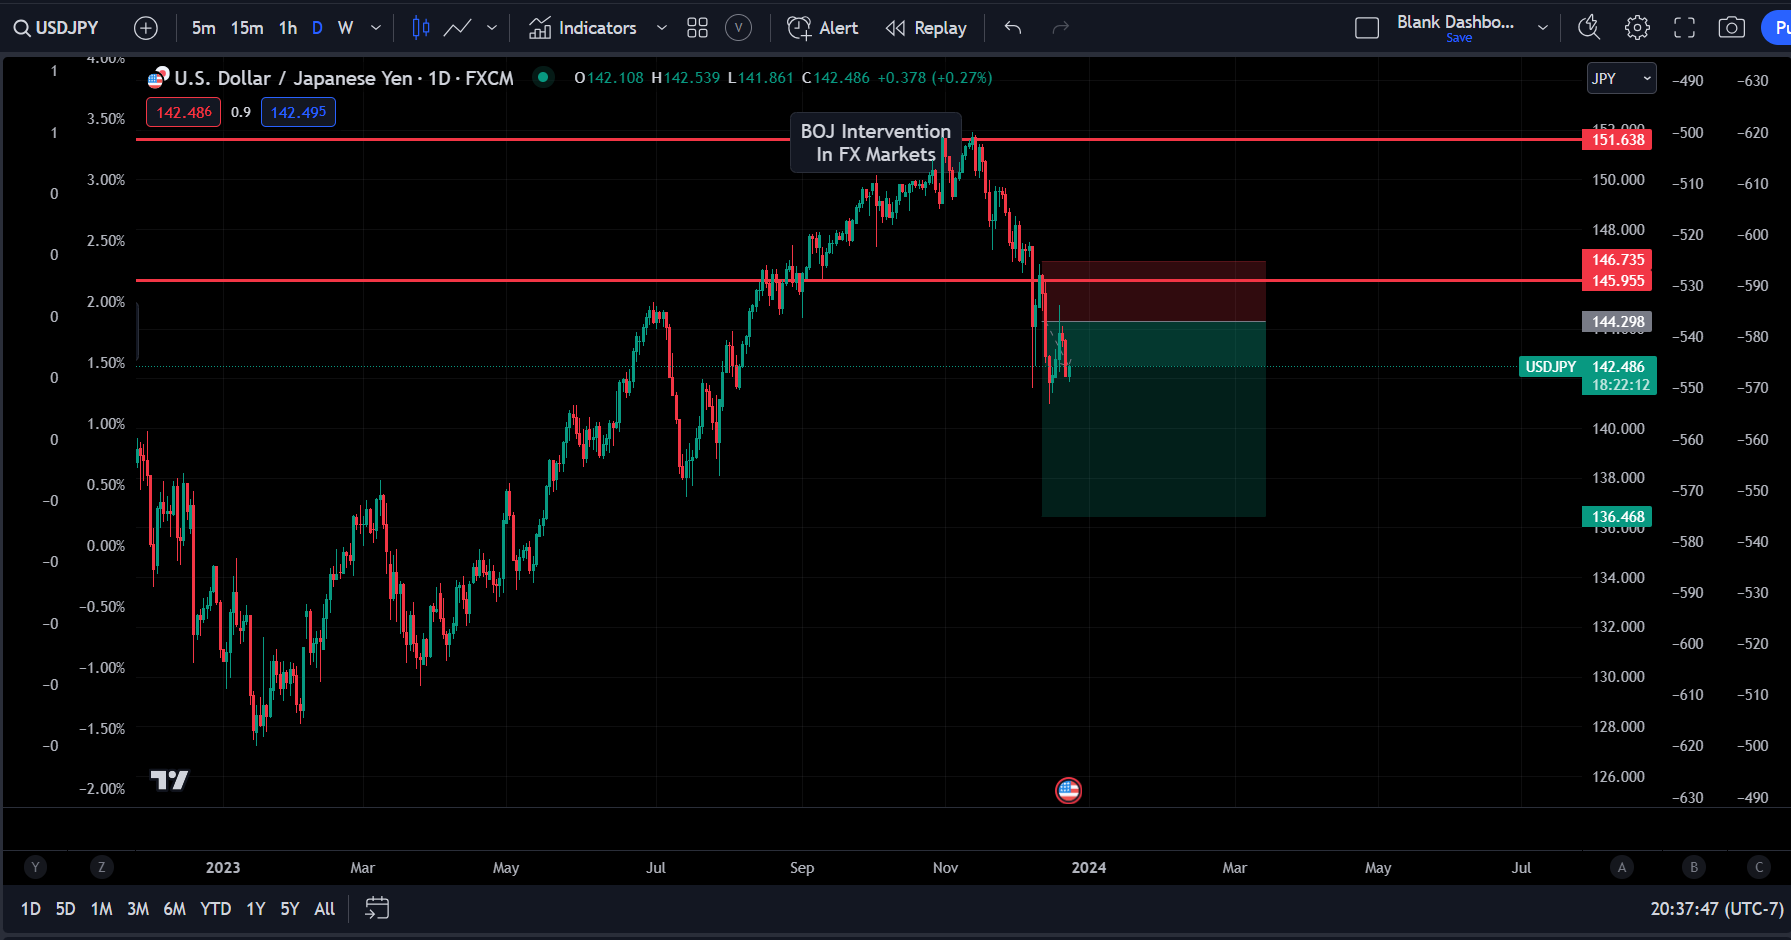
As you know, I am fundamentally bearish USDJPY. I have the short on and I am holding it (see all positions here: link):
Summary: Much of the Japanese markets revolved around the rhetoric of Ueda and the BoJ. There is a lot more going on under the surface though as nominal growth is deviating from real growth and equities are rallying. Continue to watch any changes in growth or inflation as we move through BoJ events because the marginal change in these data points can determine HOW assets move during central bank forward guidance.
Additional resources for research and trading in Japanese markets:
As we pull everything together, there are a lot of great resources out there on Japan and its financial markets. The following books are great resources:
"Japan: The Story of a Nation" by Edwin O. Reischauer.
"The Bubble Economy: Japan's Extraordinary Speculative Boom of the '80s and the Dramatic Bust of the '90s" by Christopher Wood.
"A History of Japan, 1582-1941: Internal and External Worlds" by L. M. Cullen.
"Bending Adversity: Japan and the Art of Survival" by David Pilling.
I would also recommend ALL the videos by Weston Nakamura. He has exceptional videos on Blockworks, Real Vision, and some other channels. He recently launched his own YouTube channel and I would encourage you to follow his work.
Here are some great SSRN papers on Japanese markets as well:
https://papers.ssrn.com/sol3/papers.cfm?abstract_id=4157599
https://papers.ssrn.com/sol3/papers.cfm?abstract_id=3056412#:~:text=,in%20the%20fall%20of%202017
https://papers.ssrn.com/sol3/papers.cfm?abstract_id=3512852
https://papers.ssrn.com/sol3/papers.cfm?abstract_id=2976280
https://papers.ssrn.com/sol3/papers.cfm?abstract_id=4266345
https://papers.ssrn.com/sol3/papers.cfm?abstract_id=2976280
Conclusion:
If you want to know what global macro trading is, it’s this. Doing a ton of research into HOW and WHY a country works the way it does. I forgot where I read it but I remember someone saying that nations rise and fall because of interest rates and currencies. It’s 100% true. Financial history and the development of civilization are inherently linked.
You can see that there is so much to learn. All you need is an internet connection and a mind that enjoys the intellectual challenge of finding alpha. Japan is only the beginning. The world is full of countries with hidden investment opportunities. This Substack is dedicated to building the knowledge base to find these gems.
In the information age, you simply need to be at the right place, at the right time, with the right information to succeed

Final note: I mentioned in a previous article that I have one slot open for a Bespoke client in January. If you are looking to dig into the strategic macro process further, send me an email at capitalflowsresearch@gmail.com. This would likely be for a family office or someone with a larger allocation. I can only take on one additional client right now though due to my other responsibilities.
Thanks for reading!
Amazing framework!
not sure what's your opinion of this documentary - Princes of the Yen - or if you ever watched it
https://www.imdb.com/title/tt4172710/
it is about the bubble you described and the role the central bank played in it.