The Research HUB: Unlimited Upside and Adaptive Risk Management
Always take the free call option
Hey everyone,
I hope your week is off to a good start
As a reminder, I recently did an AMA (ask me anything) Spaces covering a number of questions you submitted. Here is the recording: Link
For all the new subscribers, I started this Substack by writing a number of educational articles. When I wrote these articles, I basically asked myself, what do I wish someone had told me on my first day of trading?
Today we will be covering some educational ideas and some alpha. Topics for today:
Questions are free call options. Answering a question from a Subscriber
Adaptive Risk Management
How to use levels in price action to test a thesis
How to use Tradingview and signals I watch
Trades I am watching right now
Questions are free call options. Answering a question from a Subscriber:
This was the Tweet I put out today: Link
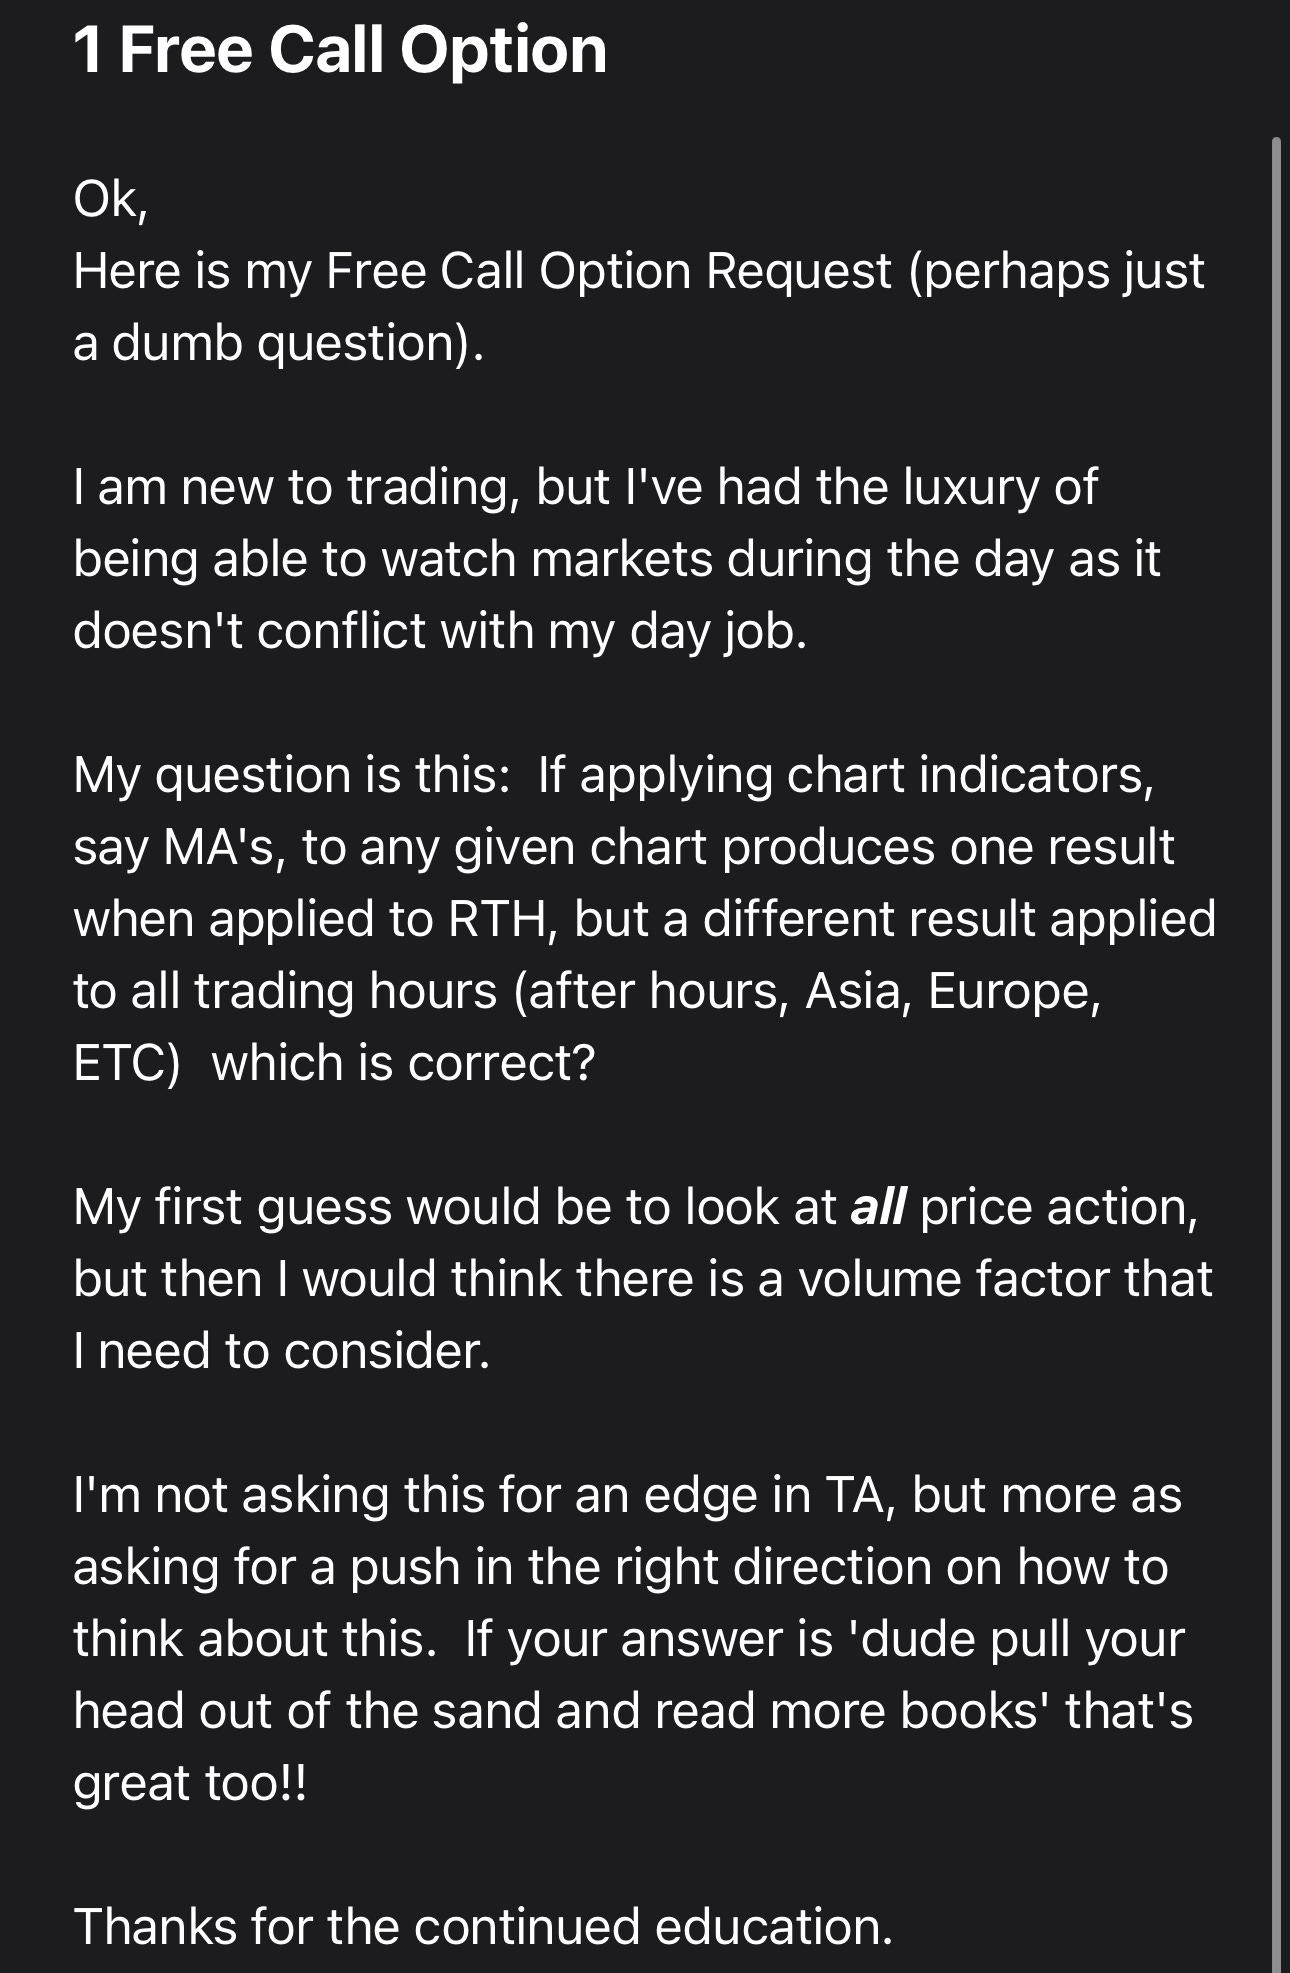
I then received this email from a subscriber. When you ask a question or reach out to someone, there is literally unlimited upside. You have no idea what outcomes could arise! So let's cash in on this option by answering the question.
Answer to Question:
First, this is a great question. It doesn't matter what domain you are in. As your knowledge progresses, your ability to ask deeper questions increases. Also, I'm not really worried about "losing my alpha" by sharing what I know. There are a number of things I can't share, but in terms of education, there really aren't a lot of "secrets."
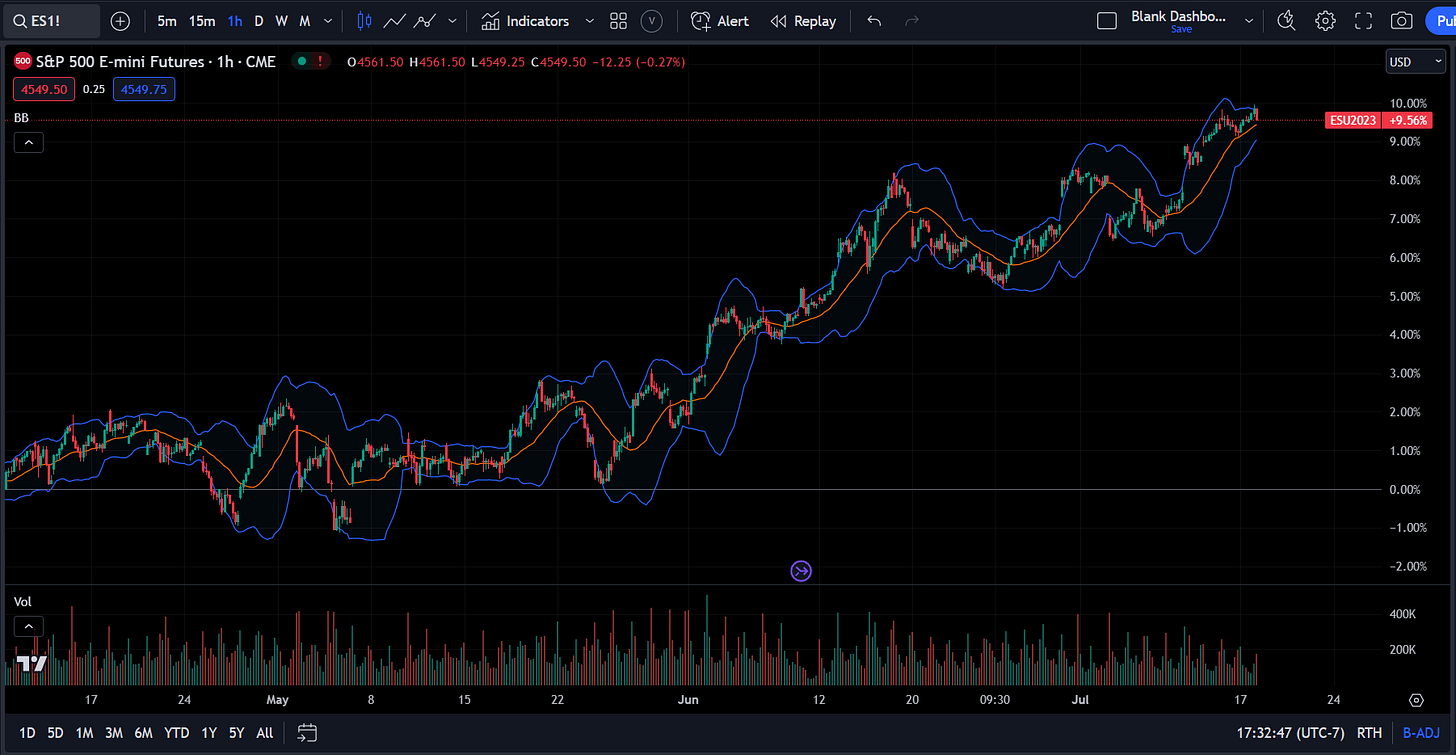
Second, the subscriber is specifically asking about which periods of time to use when analyzing price action. For example, let's say we have a strategy where we short ES when it hits the top of a Bollinger Band and buy it when it hits the bottom of the Bollinger band. This isn't a strategy that would actually work that well, but it's a good example.
Should I include the periods of low volume during the Asia and European sessions? Here is a chart with those periods of time:
Or only use the cash equity session? Here is the same chart but only during US cash equity:
You can see there is a big difference and if you begin to backtest trades, the difference will be dramatic. So which one do you use? Well, instead of looking for a prescription of "which one," let's understand the logic of these different sessions.
I actually wrote two articles touching on intraday characteristics: Link and Link
Big picture though, you need to know why specific moves are likely to occur during specific periods of time. You also need to know WHY you can even make money trading different portions of time. This doesn't just apply to financial markets. Whatever domain you operate in, you need to identify how specific slices of time exhibit specific characteristics. For example, I have a friend who ran a really large company that would source its inputs from a number of commodity producers. They would always have to know the specific seasonality or time constraints suppliers would be under in order to take advantage of it.
Another practical example that will be intuitive to everyone is that if you ask someone out on a date, there are specific times that you should probably take them out and specific times you probably shouldn't. If you try to take someone out to a 6am breakfast for a first date, it might not go well because people exhibit specific characteristics during specific periods of time. This is intuitive!
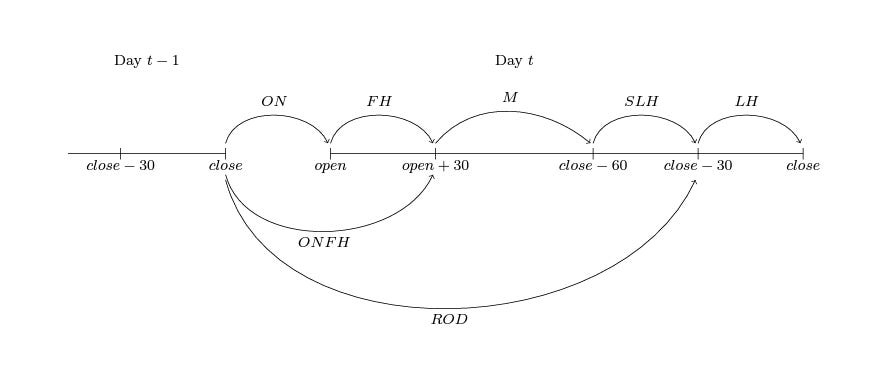
Alright so markets……..see this paper: link
Here is a breakdown of how you need to analyze price action through different slices of time:
Think about it like this, there is a reason why there is an overnight effect in the index. There is a reason there is an intraday momentum effect. There is a reason there is a weekend effect. Why? Some people have execution constraints where they can only execute during specific periods of time or can’t hold risk overnight or over the weekend.
This dynamic is different for each asset because each asset has different trading hours. For example, ags and softs have very different trading hours from equities and bonds.
So back to the question: What you need to identify is WHAT returns you are extracting, how this connect with your timeframe, and thereby connect it with your risk management. The higher the timeframe you operate on, the less these intraday effects have on signal generation. If you are running intraday trades, then it is important to identify the TYPE of returns you are extracting, which would mean you need to know WHY you are or aren't including the entire Globex session.
When you are backtesting a strategy, part of the way you can see if you have durability and aren't overfitting is by varying the window for opening a trade. For example, if I have a strategy that performs the same if I vary the windows for execution, there is a higher probability it isn’t over-optimized (again this is one metric). Let's say I have a strategy that is backtested where it executes within a 5 min timeframe in ES. How much could I "miss" this timeframe without the returns decaying? If the variability is reasonable then that means I can extract the same returns while executing before or after the window where the signal is generated. This would function the same on the daily. How much do my returns change if I execute my trades days before or after my trade signal is generated? If there are dramatic changes in returns based on small variability of the inputs (regardless of timeframe) then it’s more likely that it could be over-optimized.
An intuitive example of this would be, how much can I screw up on a date without totally blowing it? If there is a reasonable degree of variability, chances are, the person actually likes you. Doesn’t mean you should screw up intentionally, but it shows durability.
My main goal is to explain the logic of some periods or time slices as opposed to telling you that you should only use Globex hours or only use cash equity. That would be equivalent to me telling you never to go on a date at a specific time. You need to figure out what you are trying to accomplish and what characteristics are exhibited during specific periods of time.
My final point on this: I am always happy to answer questions and DMs. It’s always helpful for me if we have a common knowledge so we can build on our shared knowledge. This is why I have laid out a TON of resources in this Substack. If we both work incredibly hard, we can have mutual success 🤝.
Adaptive Risk Management:
Alright, we are going to talk about adaptive risk management. Again, this applies to all domains! If you are breathing and on planet earth, you think about risk management. Risk management is fundamentally about operating under uncertainty. For example, if the S&P 500 drops 5% tomorrow, that is not necessarily a risk to me if I own cash or am hedged. Risk management is about how I have exposure to things that negatively impact me.
This is intuitive and we are always hedging our risk in life. If you try to live in a safe neighborhood, you are trying to hedge your risk because there is likely a lower probability that you'll be the victim of a crime. If you lock your doors and have a fence, you are further hedging your risk. This is an example of “stacking” your hedges. You do multiple things to decrease the probability of negative exposure.
Let's take the example of buying a house in a safe neighborhood. If I said, you can buy this house and live in this neighborhood but you can never live anywhere else, would you take that deal? Probably not. Why? Because neighborhoods can change. So you always want the optionality of selling your house and moving for various reasons. This idea of “optionality” is critical to the idea of adaptive risk management. Why? Because you continuously have the option to change your actions as the risks change.
Here is what I said in the last article: Link
The bottom line is that we truly don’t know what will happen in a day, a week, a year, or even a decade from now. We just don’t know. Given this presupposition, we want to be able to have maximum optionality across ALL these timeframes due to the uncertainty that exists across ALL of them.
This is a key idea for adaptive risk management. You want to have maximum optionality across all timeframes. Your greatest weapon against the chaos and uncertainty of the world is maximum optionality.
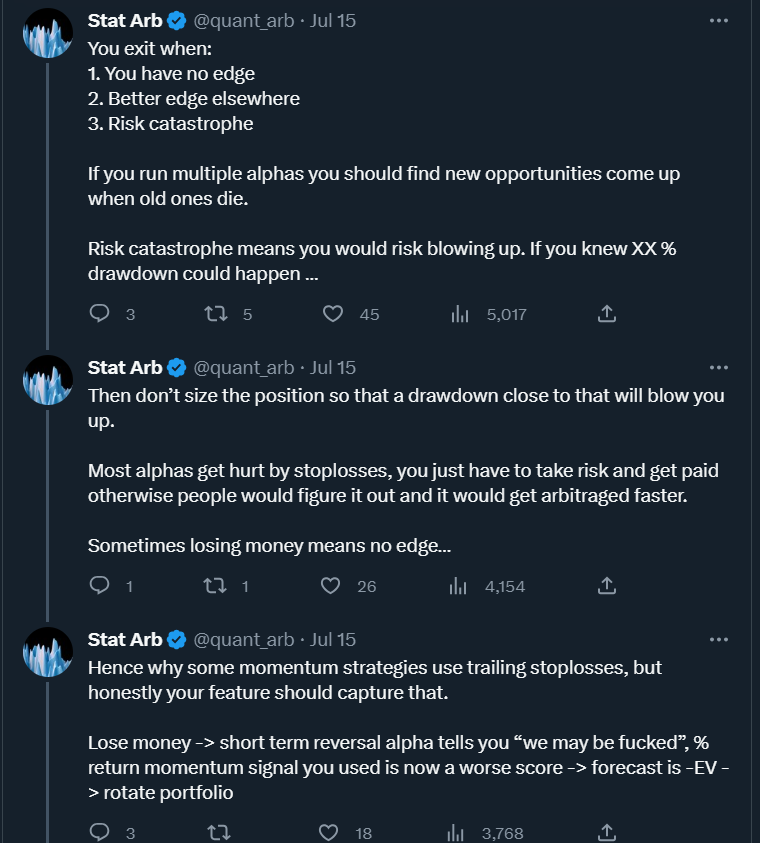
So, how does this connect to markets? There is a great Quant Twitter account that recently provided insight into this topic: Link
This Twitter account provides an exceptional representation of the tangible application of risk management as it connects to the market. The main idea is that you want to be able to continuously update your view, optionality, and risk management as new information presents itself.
As I have said, information constantly moves across the spectrum from uncertainty to certainty. So you want your execution, decision-making, and risk management to parallel this dynamic.
Most people view price action and risk in a linear and temporal fashion. They have an entry and an exit that don’t ever change as information changes. Fundamentally, you want to maintain maximum optionality as information changes. This can tangibly connect to things like stop losses, position sizing, and profit targets.
With this in mind, let's transition into a couple of ways to begin quantifying this dynamic.
How to use levels in price action to test a thesis:
Keep reading with a 7-day free trial
Subscribe to Capital Flows to keep reading this post and get 7 days of free access to the full post archives.


