

Equity Report: The Risk Reward and Trades for the S&P500
I am going to explain how to think about the skew and trades from my equity strategy

In this article, I am going to explain all of the tensions, signals, and trades for the S&P500. We have rebounded ABOVE the previous FOMC level as we rallied off the August lows. While the technical levels are clear, there is a significant edge in understanding WHY the FOMC level matters and the specific drivers that would push the S&P500 to all-time highs.
While equities were being liquidated at the beginning of August, I was very clear about the opportunity to get long and shared the risk-reward based on my strategy:
It is opportunities like the beginning of August where you can put on incredibly large bets and make outsized returns. Check out the podcast I did on HOW to think about running trades like this:

Finally, review the framework I laid out in the Macro Alpha Primers because these will set the foundation for the analysis in this Equity Report below:
Macro Alpha Primer: Credit Risk and Duration Risk and Macro Podcast: Macro Alpha Primer
Macro Alpha Primer: Correlations and Macro Podcast: Macro Alpha Primer
Macro Alpha Primer: Macro Catalysts, Hedging Pressure, and Positioning and Macro Podcast: Macro Alpha Primer
Equity Report:
Fundamentally, equities fall into the capital stack of a country as risk assets with specific exposure to the fluctuations of earnings. As a result, equities will outperform or underperform credit depending on the TYPE of credit risk taking place. This is partially why we see the total return indices for equities and credit have various degree of relative performance: The chart below shows the US aggregate equity total return index divided by the total return high yield index with changes reflected in the bottom panel.
This is more explicitly reflected in the BBB credit spread (blue) and SPX earnings yield (orange):

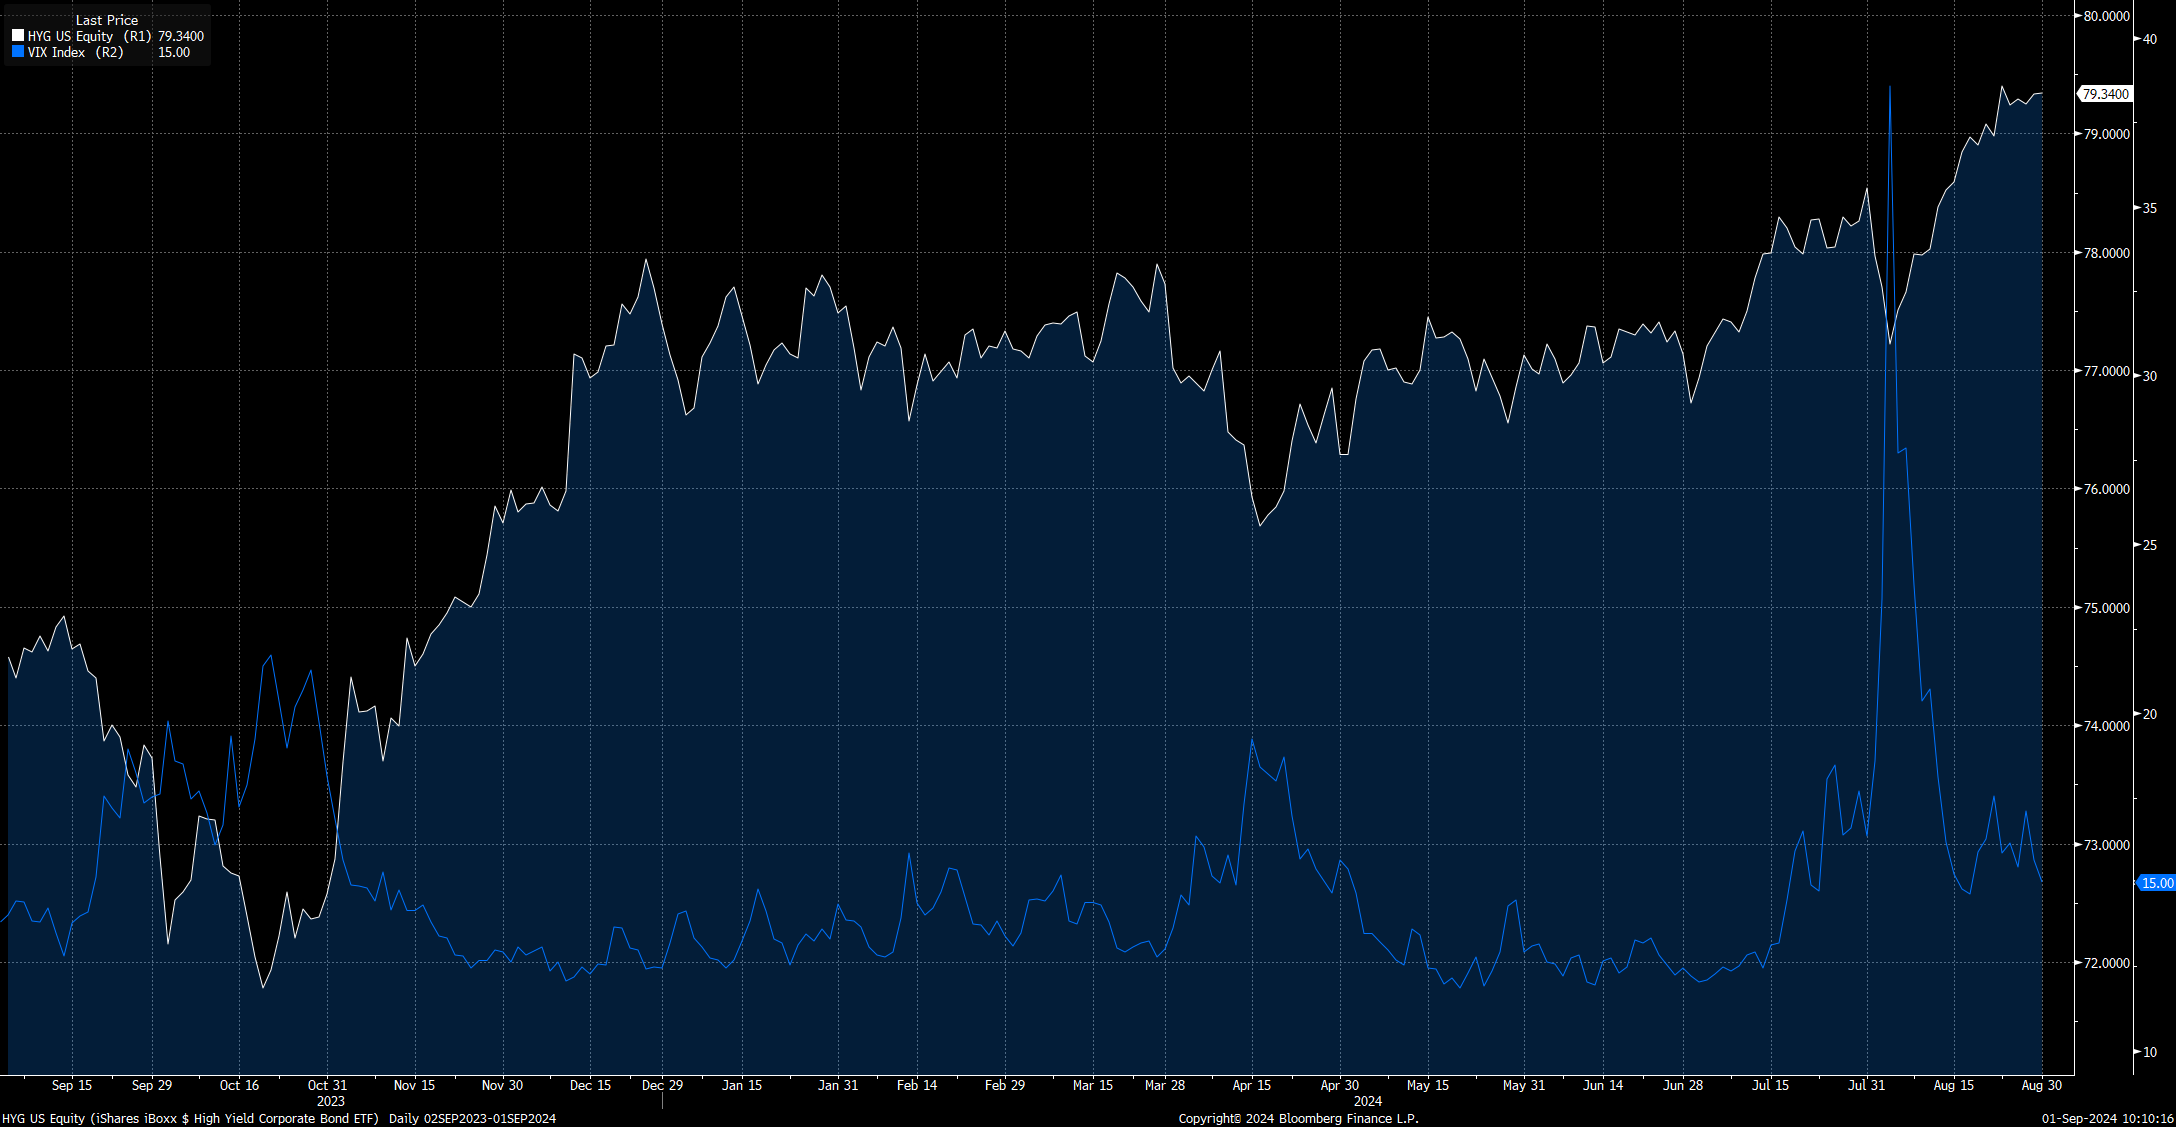
The sell-off we saw at the beginning of March clearly had no macro driver and was primarily a positioning unwind. This is reflected in how volatility blew out while the high-yield ETF made only a marginal move down.
Both credit and equities are going to be fundamentally constrained by growth in the economy. Positioning in financial markets is in a constant state of realizing the expected returns represented by underlying growth (again, please reference recent primers). This brings us to the current skew of the S&P500.
Keep reading with a 7-day free trial
Subscribe to Capital Flows to keep reading this post and get 7 days of free access to the full post archives.