Macro Update: Interest Rates, Equities, and Bitcoin
Updating market views, unwinding trades, and positioning into FOMC
Interest rates are the price of money and everything is denominated in money. Therefore, interest rates are the asymmetric linchpin on which the entire economic and financial system turns.
I have been very explicit in my views on growth, inflation, and liquidity. The evidence continues to be clear and the impact on stocks, bonds, and Bitcoin is dynamically evolving. In this article, I am going to lay out a short update on growth, inflation, and liquidity as they connect with interest rates. From here, we can have a proper framework for analyzing equities and Bitcoin.
The transmission between rates and risk assets is becoming explicit as correlation are changing and showing a marginal degree of persistence. As we move into the NFP print tomorrow and the September FOMC meeting, hedging pressure is going to come in and create a compression of the skew in assets.
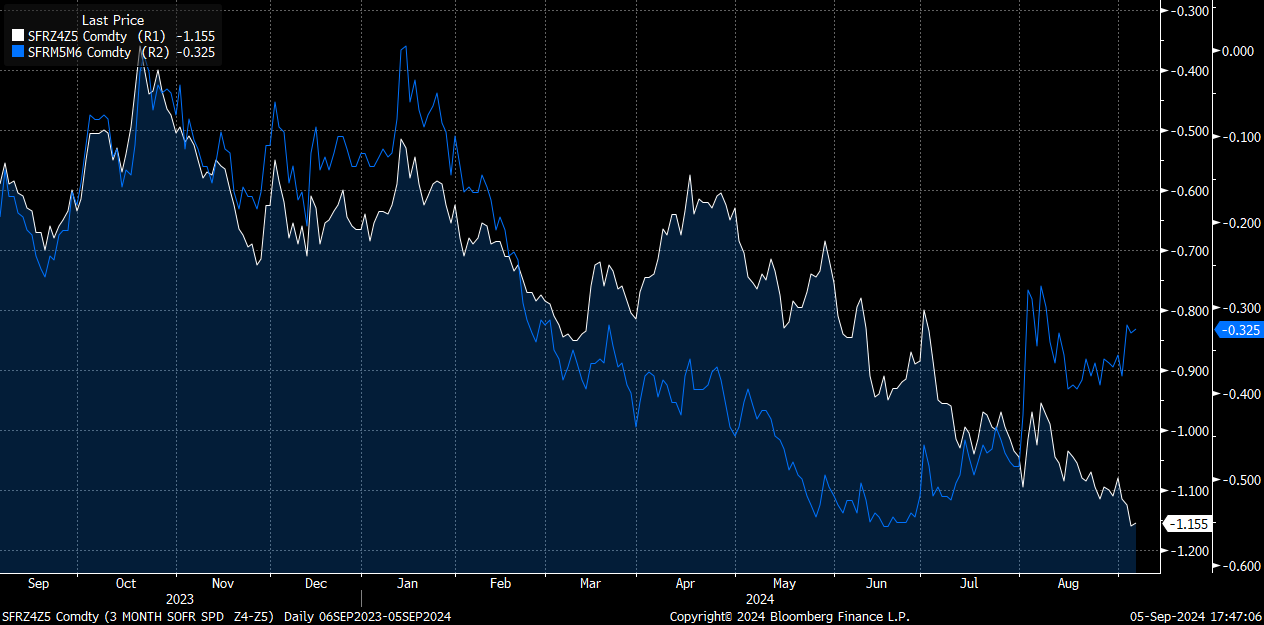
Notice that the September meeting is pricing a 40% probability of a 50bps cut. This means that if we get either a 25bps or 50bps cut in September, this contract will need to reprice which will reverberate across the curve and risk assets.
This is the main reason we have seen an acceleration in implied volatility on the most recent rally in bonds. Traders know they need to hedge their exposure because the tails are getting fatter on a marginal basis. By implication, this means that the labor market prints will have a larger impact as any hedges are unwound.
As I have said multiple times to paid subscribers, we have moved out of the regime where inflation was the main risk. Now growth scare and labor market prints are the primary risks. As a result, traders are going to hedge more around labor market prints like NFP than inflation data as they did in 2022 and 2023.
Let’s get into it!
Big Picture:
We need to start with a framework point before diving into the progression of macro views.
Main Idea: There is a difference between how macro returns are being realized and the transmission of the financial instruments into the economy. I will break this down.
Expected vs realized returns: There is always the expected return of a specific asset and then HOW MUCH of those returns are being realized. For example, if the expected returns of the S&P500 are x, the premium investors pay for those returns can change as positioning fluctures even if x is held constant. In other words, the S&P500 can move due to positioning of traders (within a specific range of variance) without the macro fundamentals of growth, inflation and liquidity changing dramatically.
There is also a difference between the economic system and financial system. Depending on a variety of factors (which we don’t have time to go into today), there can be varrying degrees of transmission from rates and asset prices. In other words, a move down or up in rates can have varrying degrees of transmission depending on how sensitive balance sheets are to changes. Why does this matter? Because changes in interest rates can occur independnet of growth and inflation. For example, the Fed can hike or cut into varrying degrees of growth and inflation. As a result, the interest rate complex interacts with varrying degrees of economic fundamentals resulting in asset prices functioning as the release valve for flows.
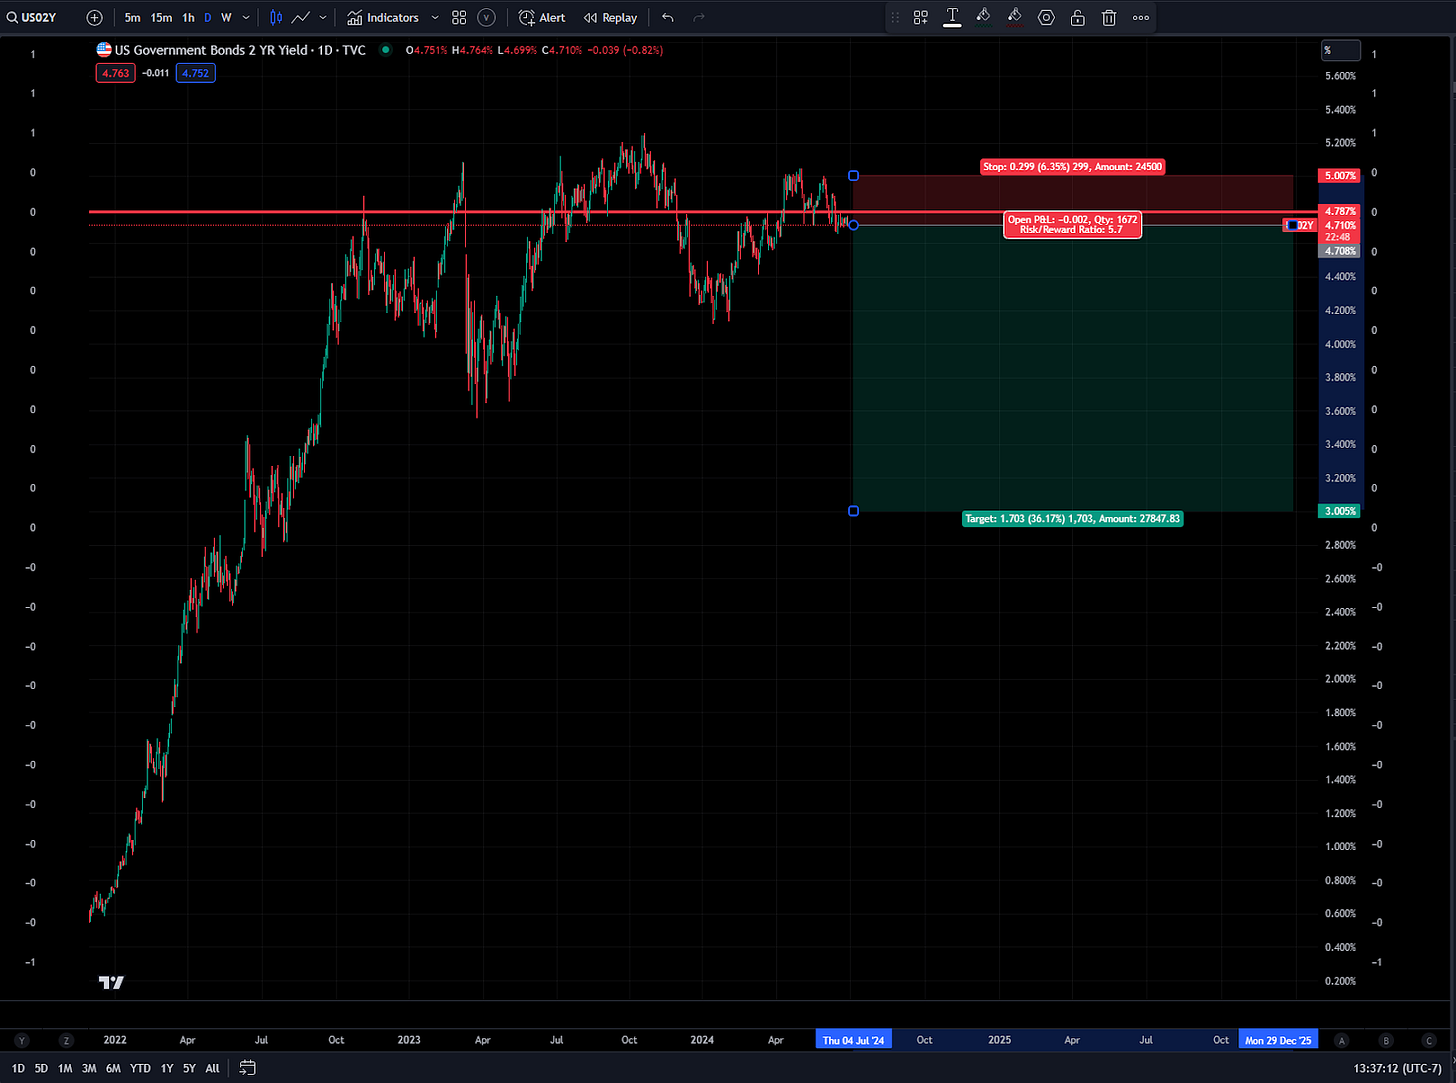
I explain this because I have laid out how interest rates are skewed to the downside since the macro report I published on June 28th (link). This was the risk reward I shared:
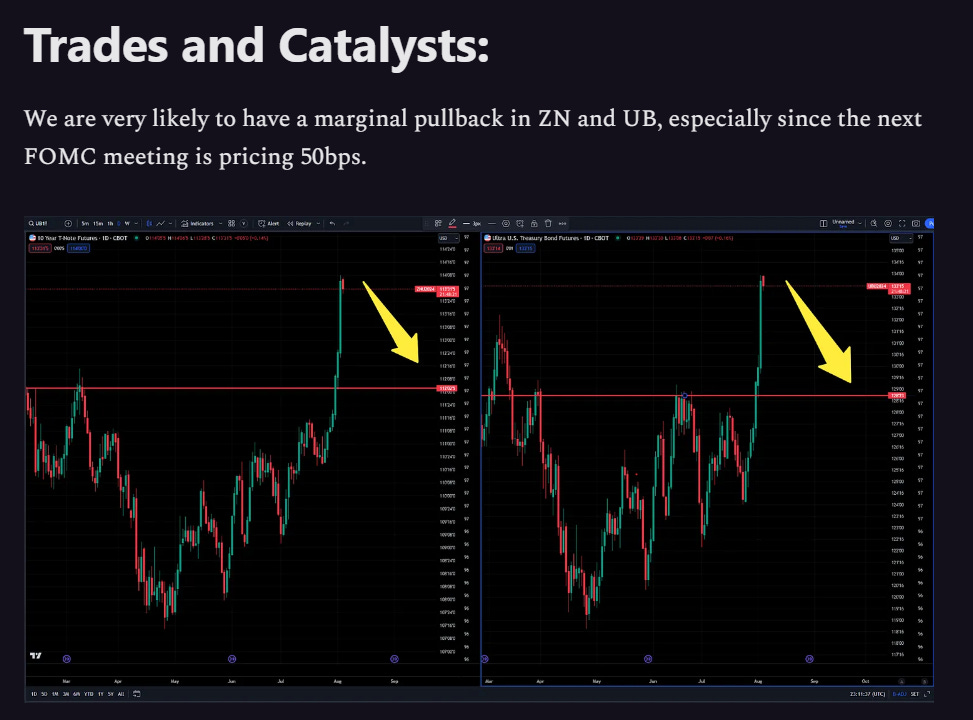
I then noted we were likely to have a short term pull back after the bid at the beginning of August (Link):
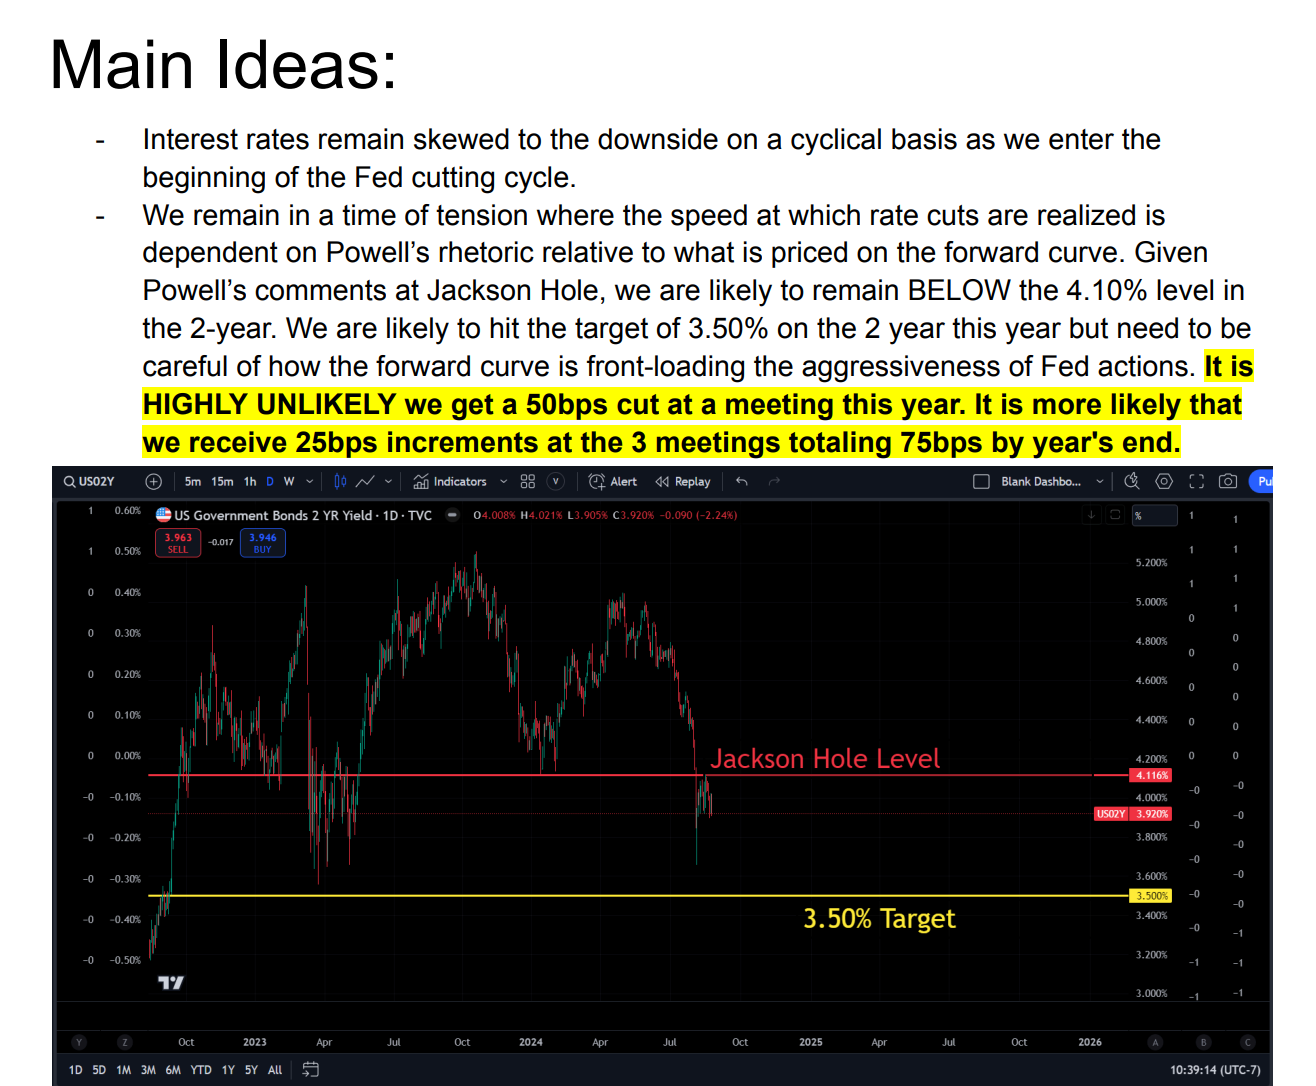
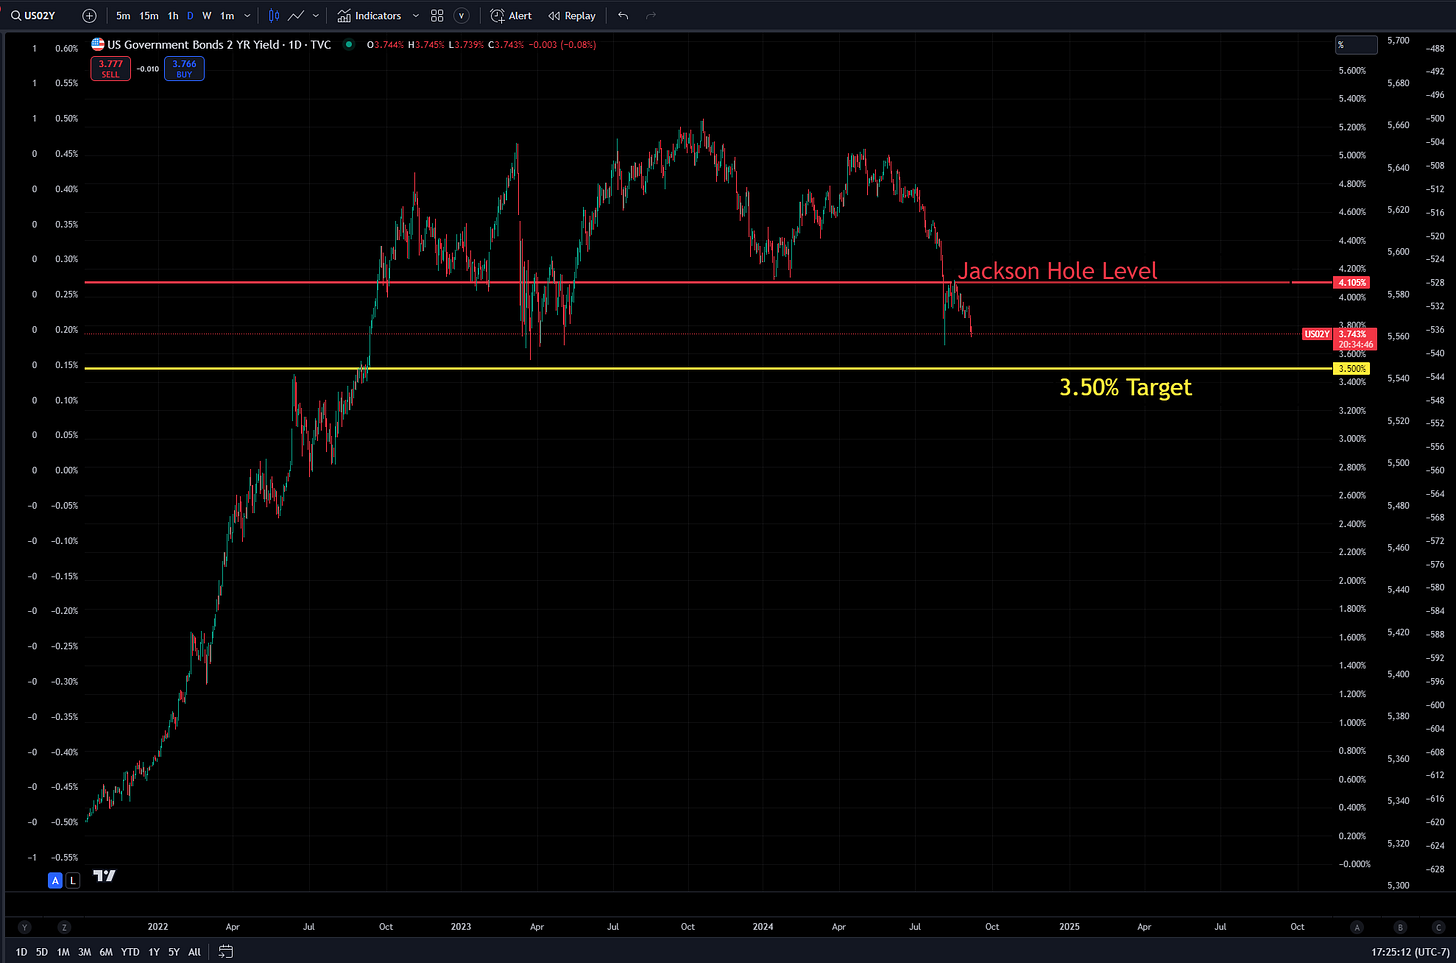
After we had the pullback, I explain how the Jackson Hole event functioned as a monetary inflection point and interest rates were likely to continue moving down after the short term consolidation. The Jackson Hole event function as very clear resistence in rates (Link):
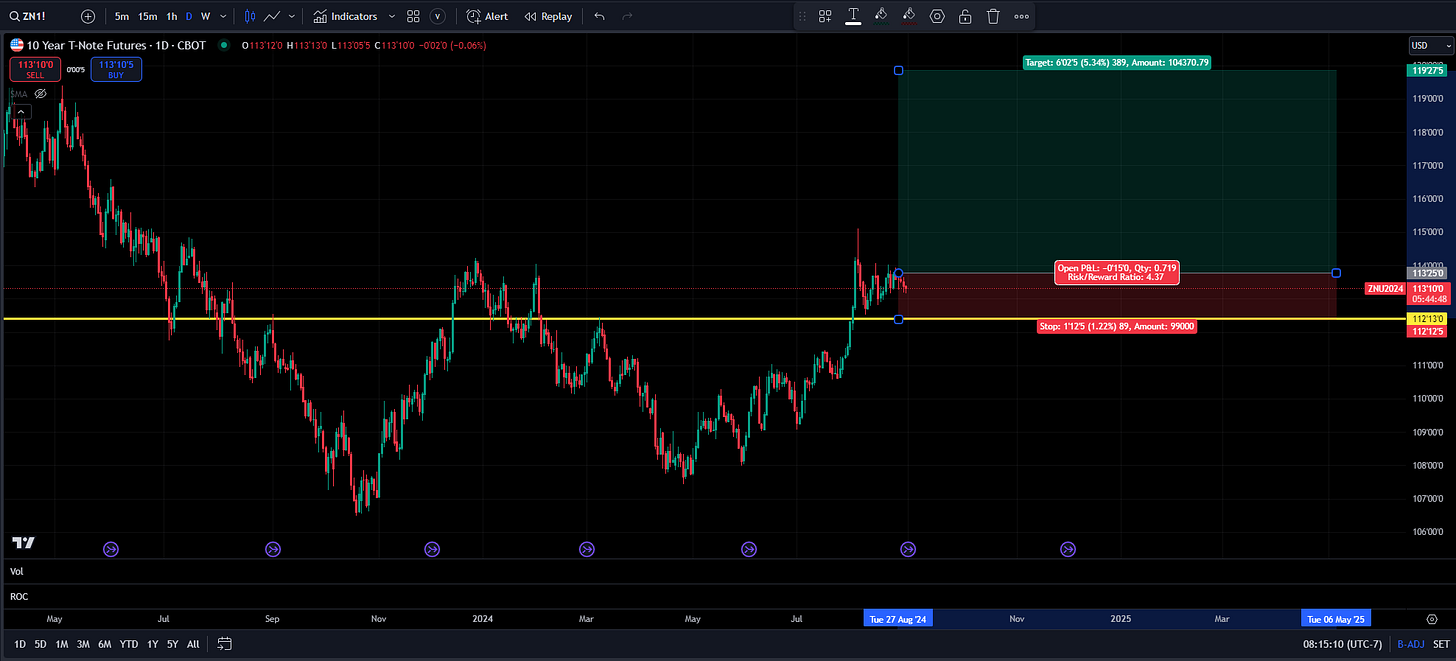
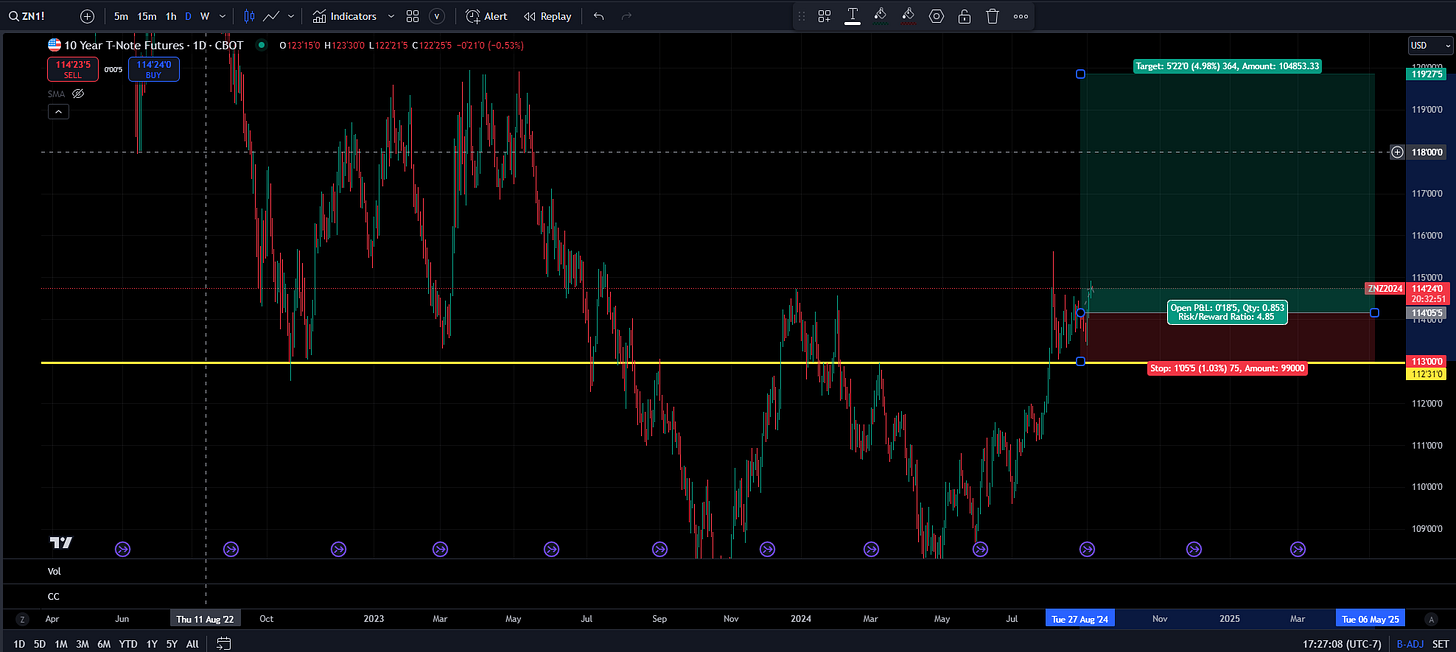
I then noted a long ZN trade (link) explaining how the bull steepener and uninversion would cause a strong bid in ZN and UB:
Since these views on the short end and long end, the 2 year as moved down 18bps closer to the 3.50% that was noted:
Additionally, ZN is now onsides (link)
This has occurred as the curve bull steepens and pushes against the zero level:
The key thing I want you to notice about this is that I have laid out the growth and inflation view as Goldilocks: This means positive growth and falling inflation. The Goldilocks regime was incredibly clear in the personal income and outlays data I did an analysis of last week (link):
I have laid out in all of the research the following two points:
Growth is positive but a greater dispersion than 2023. Inflation is falling and the primary driver of interest rates moving down.
The Jackson Hole event indicated a monetary inflection point where the Fed is clearly skewing rates to the downside. The market will now be pricing more premiums for the speed for rate cuts.
This brings us to the NFP event this week as we move into the Septemeber FOMC.
NFP, FOMC, and Macro Tensions:
As I noted at the beginning, the Sept FF contract is functionally pricing a coinflip for the Sept meeting. Since we are in the window of silence for Fed speakers, data during this time with this type of pricing on the forward curve is likely to cause larger moves.
Paid Subscribers on the Substack know that I don’t take coinflip trades. I always execute at extremes and have a different time preference and risk tolerance than the market. This is WHY my stops on the ZN trade are BELOW the Jackson Hole level.
The NFP print will provide a further shock to positioning and we still need to see a reversion of how the rate cuts are distributed (I laid out this entire tension in the report here: Link)
Where does this leave us and what does this tanbibly mean?
The implication of all of this is that bonds remained skewed to the upside on a cyclical basis but the market is likely pricing the Sept meeting and other meetings in 2024 a little to aggressively.
The skew of rates remains but we might consolidate ABOVE the Jackson Hole level for a period of time before we move into the next stage of the cycle.
This dynamic with rates and the underlying macro conditions contextualize equities and Bitcoin.
Equities and Bitcoin:
If you have been following me, you know I have been long both stocks (link) and bonds together because of the Goldilocks regime. I have also been long Bitcoin (link). The bond position has paid while the risk assets (BTC and equities) have had negative returns. I have said over and over, there is more optionality being long BOTH because if we have Goldilocks then both go up but if we have risk assets down and bonds bid (like we have seen over the past 2 weeks), these positions offset each other! This trade construction is critical!
As of today, my strategies are neutral on equities and Bitcoin. I have taken off BOTH positions and will wait for a better entry with greater edge. I am still holding the long bond position but am careful here since due to the aggressiveness of the forward curve.
The logic: On a cyclical basis, equities remain bullish but I am here to generate alpha. When my strategy triggers another ES long, I will share it with Paid Subscribers.
We are beginning to tick up in implied vol premiums and we have seen two weeks of negative returns in ES with NQ leading the way:
How To Take A Big Swing:
My goal in trading is to find exceptional risk reward opportunities to take large swings. I have laid this out here:
Macro Alpha Primer: Stacking Edges To Identify a Sucker
Today, we are bringing together the Macro Alpha Primers to an end with a Synthesis Primer. In macro (and life), the more you learn, the more you grasp the complexity of variables and their relationship to each other. As you move to higher levels of learning, you need to synthesize information based on presuppositions that have a strong foundation. This …
and here:
Right now I am holding my long bond position but I am in the process of identifying new trades with asymmetrical upside. We are likely to have a swing in FX or the metals as we move into or come out of FOMC. I will provide an update tomorrow after NFP and break things down further. Thanks!
As always, a Pepe for the culture!
The information on this website/Substack is for information purposes only. It is believed to be reliable, but Capital Flows does not warrant its completeness or accuracy. The information on the website/Substack is not intended as an offer or solicitation for the purchase of stock or any financial instrument. The information and materials contained in these pages and the terms, conditions and descriptions that appear, are subject to change without notice. Unauthorized use of Capital Flows websites and systems including but not limited to data scraping, unauthorized entry into Capital Flows systems, misuse of passwords, or misuse of any information posted on a site is strictly prohibited. Your eligibility for particular services is subject to final determination by Capital Flows and/or its affiliates. Investment services are not bank deposits or insured by the FDIC or other entity and are subject to investment risks, including possible loss of principal amount invested. Your use of any information which is proprietary to Capital Flows or a third-party information provider shall only be used on individual devices without any right to redistribute, upload, export, copy, or otherwise transfer the information to any centralized interdepartmental or shared device, directory, database or other repository nor to otherwise make it available to any other entity/person/third party, without the prior written consent of Capital Flows.






Hedges are fine too
Hi there, love the posts. which post explains how to use implied volatility vs realized vol ? Or is it just that an implied volatility premium implies that it “pays” to be long the respective asset. Or is there more to it?