

Macro Regime Tracker: Equity Sell Off
Macro regime and risk assets qualified clearly

Macro Regime Tracker:
The Macro Regime Tracker offers a daily lens on how shifts in growth, inflation, and liquidity affect short-term risk and reward. Leveraging machine learning, AI, and cross-asset data, it identifies macro changes and their impact on market positioning.
You can find the video I recorded here that explains the new models and drivers (link)
Macro Regime Tracker Index:
Macro Regime Context
Macro Tear Sheets: Equities, Fixed Income, FX, Crypto, and Commodities
Macro Regime Dashboard: Excel spreadsheet for economic data and interest rates
Growth, Inflation, Fixed Income, Credit, and Equities Regime Tracker
AI and Machine Learning Strategies - Macro Regime and Positioning Premiums Strategies: S&P 500, 2-Year Interest Rates, Gold, and Bitcoin
Macro Regime Context:
We are in a consequential time in markets as the VIX closed at 45 today, and equities saw vicious selling pressure across every sector.

Managing these periods of time is THE differentiating factor for both active and passive investors. As we came into this week, the warning signs were clear and picked up by the equity model as it was skewing prices to the downside moving into today. Monitoring the macro and positioning drivers is THE KEY to knowing WHEN a potential bottom occurs or if we see further downside moving into markets on Monday. As I have said multiple times, the larger the drawdown, the greater the macro drivers we see for a bottom and reversal to occur. I will lay these out further in the strategy section.

Main Developments In Macro
*CHINA TO IMPOSE 34% TARIFF ON ALL US GOODS FROM APR.10: XINHUA
*RUBIO SAYS `MARKETS WILL ADJUST' TO US TARIFFS
*US MARCH UNEMPLOYMENT RATE 4.2%; EST. 4.1%
*US MARCH NONFARM PAYROLLS RISE 228,000 M/M; EST. +140K
*TRUMP: THIS A GREAT TIME TO GET RICH, RICHER THAN EVER BEFORE
*TRUMP SAYS POWELL 'IS ALWAYS LATE'
*POWELL: WE'RE NOT IN A SITUATION LIKE IN THE 1970S
*POWELL: FED WAITING FOR CLARITY ABOUT WHAT OUR POLICY SHOULD BE
*POWELL: UNCERTAINTY SHOULD BE MUCH LOWER A YEAR FROM NOW
*POWELL: FED IS NOT RESPONSIBLE FOR TRADE, IMMIGRATION POLICY
*POWELL: FED TRIES TO STAY AWAY FROM THE POLITICAL PROCESS
*POWELL: OUTSIDE FORECASTERS HAVE RAISED LIKELIHOOD OF RECESSION
*POWELL: UNEMPLOYMENT IS STILL LOW
*POWELL: INCOMING DATA STILL SHOWS A SOLID ECONOMY
*POWELL: ECONOMY CLOSE TO MAXIMUM EMPLOYMENT, STILL GROWING
Macro Tear Sheets: Equities, Fixed Income, FX, Crypto, and Commodities
Macro Regime Dashboard: Excel spreadsheet for economic data and interest rates
Growth, Inflation, Fixed Income, Credit, and Equities Regime Tracker
The Macro Regime Model offers a real-time view of growth, inflation, and yield curve dynamics, integrating these with credit market shifts, equity risk premiums, and positioning data. It connects upcoming catalysts to statistical drivers of asset prices, creating a unified framework that quantifies skew and clarifies risk-reward across asset classes.
Key Points:
S&P 500 Intraday – Risk-Off Deepens Amid Tariff Escalation
The S&P 500 fell sharply today, closing down -3.67%, marking a significant acceleration in downside momentum compared to yesterday’s -1.68% decline. The catalyst: the formal implementation of new U.S. tariffs on Chinese goods, quickly followed by retaliatory measures out of Beijing. Markets responded with a broad-based and mechanical sell-off, consistent with a deleveraging regime, not panic.
Losses were again widespread, but deeper and more evenly distributed across sectors. Key contributors included:
Information Technology (-1.11%): Once again the heaviest drag, reflecting beta purge and growth exposure unwinding.
Financials (-0.85%) and Healthcare (-0.55%): Together with Tech, these sectors drove the bulk of the move.
Industrials (-0.34%) and Consumer Staples (-0.26%): Joined the downside pressure as trade-sensitive and defensive areas alike sold off.
Even Utilities (-0.15%), REITs (-0.09%), and Staples (-0.26%) offered no shelter.
This is not a rotation, it’s a full-scale risk reduction — the entire market is in unwind mode. The decline is orderly but relentless, suggesting systematic flows and stop-outs, not discretionary panic.
Yesterday's narrative, “no place to hide” has only intensified. Every sector closed negative, with no sign of crowding into defensives or yield proxies. The S&P 500's -3.67% fall underscores that this is no ordinary pullback; it's a broad repricing of risk, catalyzed by a real-world macro shock.

&P 500 Intraday – Full-Blown Capitulation (Unweighted)
Tariff Shock Triggers Classic Recession Trade
The S&P 500 ended the day down -3.67%, but the unweighted damage reveals a far more violent unwind beneath the surface. This was indiscriminate selling not just broad, but deep and vicious across classic cyclical sectors.
Cyclical Carnage – No Place to Hide
Energy (-7.05%): Absolute capitulation. This kind of move speaks to forced selling and liquidations not just falling crude.
Financials (-5.90%), Utilities (-5.61%), Healthcare (-4.77%): Deep losses even in typically “defensive” pockets.
Industrials (-4.03%), Materials (-4.88%), Staples (-4.02%): Textbook recession repricing. This is the market trying to get ahead of a growth shock.
Discretionary (-0.85%): Surprisingly resilient, but the relative outperformance is likely a function of the breadth of the rest collapsing.
Largest Index Weights Crushed
Tech (-3.82%), Financials (-5.90%), Staples (-4.02%), Health (-4.77%) all down heavily on an unweighted basis, confirming that even megacaps weren’t spared. There’s nowhere to hide.
This Is Not a Rotation. It’s a Liquidation.
This isn’t a hedge, it’s a race for cash. Everything from high beta to low vol is getting dumped.
No safe havens: REITs (-3.86%) and even Utilities (-5.61%) were trashed, likely reflecting margin-related selling.
The unweighted internals speak louder than the headline index: this is classic macro de-risking, likely fueled by both fundamental concerns (tariffs, growth, margins) and mechanical drivers (stop-outs, deleveraging).

S&P 500 Sector Breadth – Total Breakdown Across All Timeframes
The final session’s price action wasn’t just ugly, it ripped apart the underlying structure of the S&P 500. The charts of 10-day, 20-day, and 50-day moving average sector contributions all show the same story: a complete smash in breadth.

Credit Risk Blows Wider – No More Ignoring It
Credit is now clearly catching up to equities and rates in pricing macro stress. The index just surged to 72.20, the highest since mid-2023, decisively breaking above both its multi-month range and its long-term average (~62.9). This isn't a wobble, it's a material repricing of credit risk.
This is systemic, not idiosyncratic.
There’s no single corporate story to point to here, this is macro stress transmitting across all asset classes. Rates, equities, and now credit are all saying the same thing: the market is re-assessing the global growth and policy outlook in real-time.
The last few months lulled many into thinking credit would remain well-behaved amid rising equity volatility. That illusion is gone. Credit is now fully participating in the risk-off move, and its recent velocity adds a potential accelerant to any further equity downside.
STIRs Blow Wider as Market Prices Over 100bps of Cuts – Fed Still on the Sidelines
The STIR complex just delivered a powerful message: the market now sees over 100bps of rate cuts by the end of 2025, with 133bps priced through July 2026. That’s a 40bps dovish shift in just a few days, driven by a collapse in equities, widening credit spreads, and rising fears of a policy mistake.
But the Fed isn’t blinking. Chair Powell’s latest remarks paint a central bank that is very aware of rising downside risks, but in no rush to act.
The Fed Is Watching – But Waiting
Despite the market’s clear shift in expectations, Powell signaled:
“We’re not in a situation like the 1970s.”
“The Fed is waiting for clarity about what our policy should be.”
“Outside forecasters have raised the likelihood of a recession.”
Yet in the same breath, he emphasized:
“Incoming data still shows a solid economy.”
“Unemployment is still low.”
“The economy is close to maximum employment and still growing.”
The subtext is clear: the Fed sees the market moving but won’t react just because asset prices are under pressure. It’s comfortable letting financial conditions tighten via market mechanisms while it waits for the data to break.

In this context, we ran a short-term trade in the tactical portfolio (these are laid out in the chart section: LINK). What we saw was such an aggressive and forced unwind that Fed Funds for April actually priced hikes that were likely unrealistic given the underlying economic fundamentals.

Our internal notes will continue to be laid out in the chat function
Macro Regime and Positioning Premiums - Strategies:
As of market close, the strategies have updated, and here are the new directional skews. I want to walk you through the logic for WHY these are this way so you can understand HOW to think about markets on Monday.
Equities (ES)
==================================================
Technical Levels for ES1 Index (Date: 2025-04-04)
==================================================
Daily Range: 93.05
Resistance Levels (Above Open):
------------------------------
R5: 5634.68 | Offset: +211.68
R4: 5567.42 | Offset: +144.42
R3: 5560.12 | Offset: +137.12
R2: 5551.30 | Offset: +128.30
R1: 5440.81 | Offset: + 17.81 *
------------------------------
Open Price: 5423.00
------------------------------
Support Levels (Below Open):
------------------------------
S1: 5338.83 | Offset: - 84.17 *
S2: 5285.88 | Offset: -137.12
S3: 4986.68 | Offset: -436.32
S4: 4977.83 | Offset: -445.17
S5: 4845.42 | Offset: -577.58
==================================================
* Denotes intraday level, likely tested
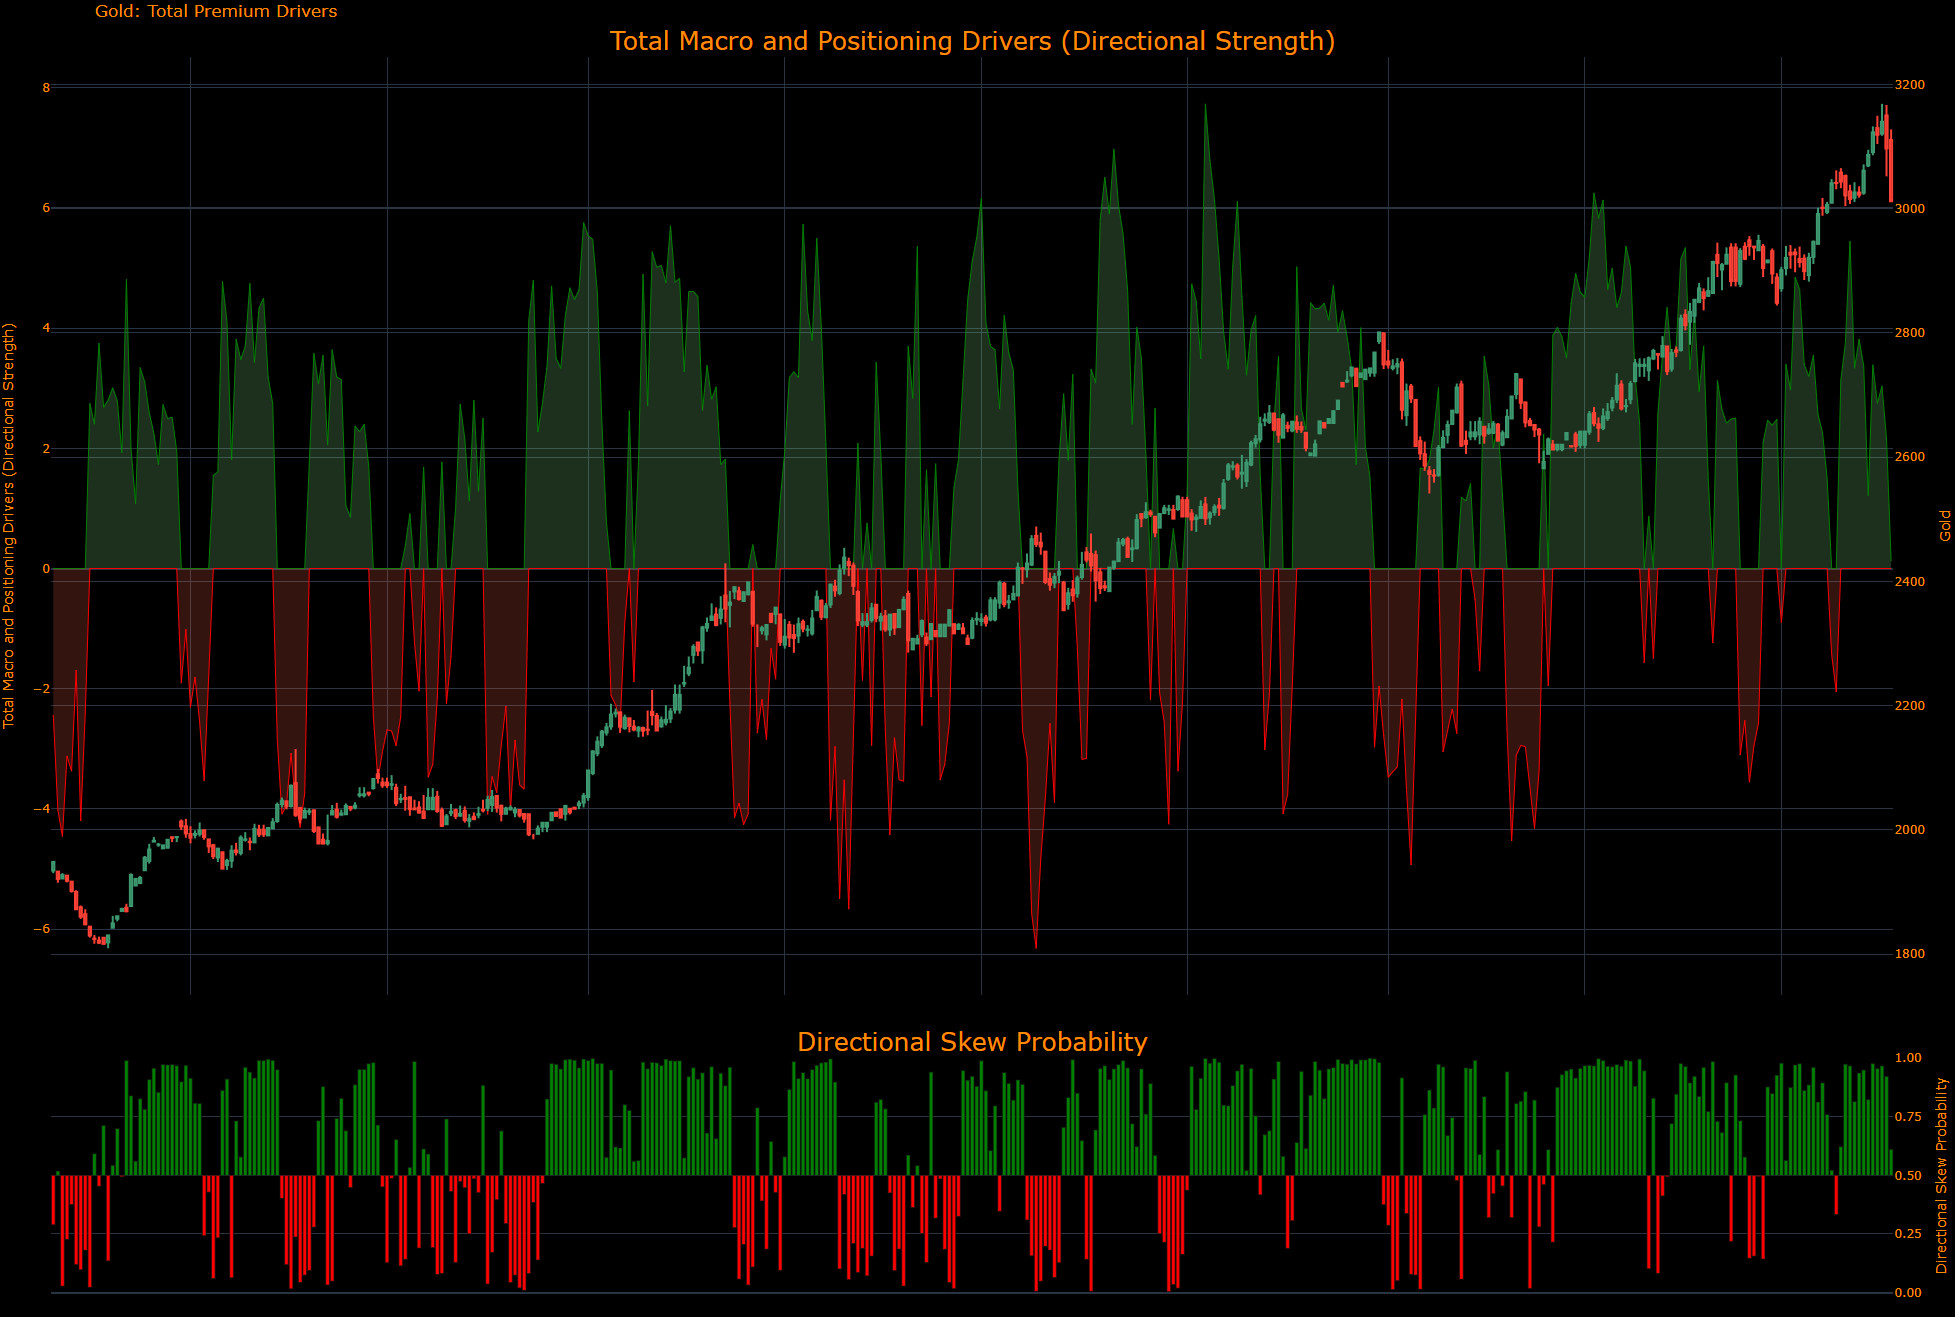
(In the top panel, the total impulse of macro drivers and positioning is illustrated in its strength. The greater the strength in the move, the higher the probability and amplitude of the move that is likely to take place. The bottom panel illustrates if the skew is either bullish or bearish probability.)
Notice that the ES strategy has flipped positive
(The next three charts show the underlying contribution for the Total Macro and Positioning Drivers in the chart above. These allow you to see the WHY behind moves.)
(The Equity Risk Premium contribution aggregates major macro factors and the strength of factors driving equity risk premiums. In the same manner, the higher the contribution moves, the more strength the drivers have in pushing the index in a specific direction.)
Equities continue to have macro drivers putting downward pressure on them as the chart below illustrates.

(The Positioning Premium Driver contribution identifies HOW the drivers of positioning are contributing to equity returns. In the same manner, the higher the contribution moves, the more strength the drivers have in pushing the index in a specific direction.)
Positioning has flipped back to marginally positive in its force on ES, which means the forced unwind has lost some strength.

(The Growth Risk Premium Driver contribution identifies HOW the drivers of growth are contributing to equity returns. In the same manner, the higher the contribution moves, the more strength the drivers have in pushing the index in a specific direction.)
The growth risk premia has flipped positive, though which is important to note because we aren’t seeing a complete collapse in growth yet. This might happen, but we need to time our actions correctly.
On net, the ES model has flipped marginally positive for a bullish directional skew. However, the strength of the underlying factors still has risks. In other words, being cautious into Monday is important, but betting on an immediate downside has a lower risk reward.
2-Year Interest Rate
==================================================
Technical Levels for USGG2YR Index (Date: 2025-04-04)
==================================================
Daily Range: 0.06
Resistance Levels (Above Open):
------------------------------
R5: 3.84 | Offset: + 0.16
R4: 3.84 | Offset: + 0.16
R3: 3.78 | Offset: + 0.10
R2: 3.77 | Offset: + 0.09
R1: 3.75 | Offset: + 0.07
------------------------------
Open Price: 3.68
------------------------------
Support Levels (Below Open):
------------------------------
S1: 3.58 | Offset: - 0.10
S2: 3.51 | Offset: - 0.17
S3: 3.49 | Offset: - 0.19
S4: 3.37 | Offset: - 0.32
S5: 3.27 | Offset: - 0.41
==================================================
* Denotes intraday level, likely tested
(In the top panel, the total impulse of macro drivers and positioning is illustrated in its strength. The greater the strength in the move, the higher the probability and amplitude of the move that is likely to take place. The bottom panel illustrates if the skew is either bullish or bearish probability.)
This marginal shift in ES has overlapped with the downside in the 2 year, beginning to decrease. I laid out the trade write up (link) explaining how significant upside existed in both the 2026 SOFR contracts to price more cuts AND upside in ZN. These have been realized and especially in light of Powell’s comments today, taking additional aggressive bets on the long side in bonds is beginning to be less attractive between now and FOMC.

(The Inflation Risk Premium Driver contribution identifies HOW the drivers of inflation expectations are contributing to 2-year returns. In the same manner, the higher the contribution moves, the more strength the drivers have in pushing rates in a specific direction.)

(The Commodity Premium Driver contribution identifies HOW the drivers of commodities are contributing to 2-year returns. In the same manner, the higher the contribution moves, the more strength the drivers have in pushing rates in a specific direction.)

(The Growth Risk Premium Driver contribution identifies HOW the drivers of growth are contributing to 2-year returns. In the same manner, the higher the contribution moves, the more strength the drivers have in pushing rates in a specific direction.)

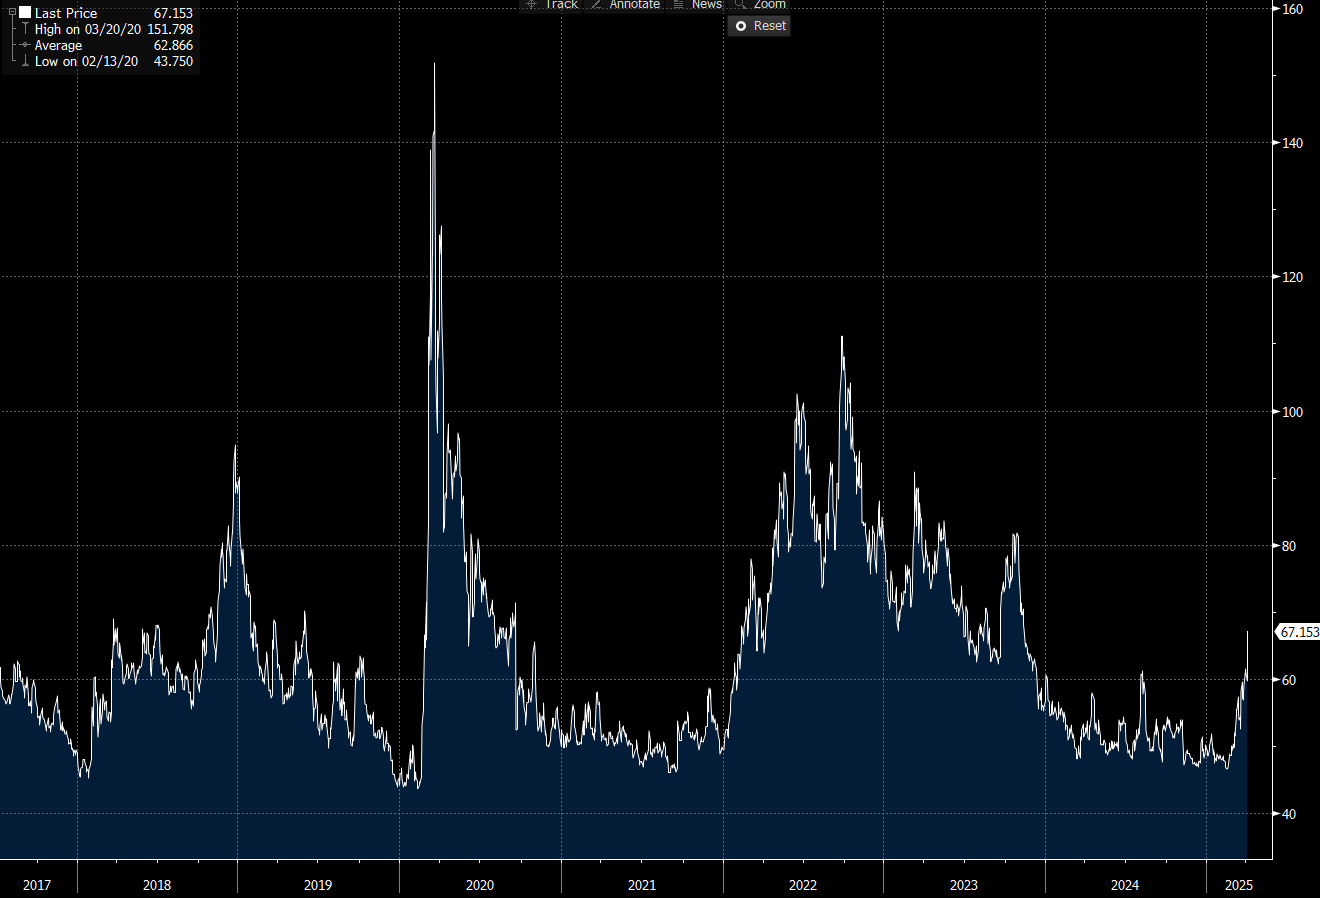
Gold
==================================================
Technical Levels for GC1 Comdty (Date: 2025-04-04)
==================================================
Daily Range: 34.62
Resistance Levels (Above Open):
------------------------------
R5: 3217.42 | Offset: +106.92
R4: 3206.17 | Offset: + 95.67
R3: 3166.93 | Offset: + 56.43
R2: 3163.75 | Offset: + 53.25
R1: 3131.75 | Offset: +21.25 *
------------------------------
Open Price: 3110.50
------------------------------
Support Levels (Below Open):
------------------------------
S1: 3089.47 | Offset: - 21.03 *
S2: 3073.00 | Offset: - 37.50
S3: 3070.21 | Offset: - 40.29
S4: 3066.92 | Offset: - 43.58
S5: 3057.25 | Offset: - 53.25
==================================================
* Denotes intraday level, likely tested
In the top panel, the total impulse of macro drivers and positioning is illustrated in its strength. The greater the strength in the move, the higher the probability and amplitude of the move that is likely to take place. The bottom panel illustrates if the skew is either bullish or bearish probability.
Over the last 2 months, gold has risen more than most people have expected, and equities have fallen more than expected. The strength in drivers to the upside has decreased marginally, but the skew remains to the upside.
(The US Macro Liquidity Driver contribution identifies HOW the drivers of US liquidity are contributing to the returns of Gold. In the same manner, the higher the contribution moves, the more strength the drivers have in pushing gold in a specific direction.)

(The Gold Risk Premium Driver contribution identifies HOW the risk premium of gold is contributing to returns. In the same manner, the higher the contribution moves, the more strength the drivers have in pushing gold in a specific direction.)

(The Dollar Liquidity Driver contribution identifies HOW the drivers of dollar liquidity are contributing to the returns of Gold. In the same manner, the higher the contribution moves, the more strength the drivers have in pushing gold in a specific direction.)

The Global Liquidity Driver contribution identifies HOW the drivers of global liquidity are contributing to the returns of Gold. In the same manner, the higher the contribution moves, the more strength the drivers have in pushing gold in a specific direction.

Bitcoin
==================================================
Technical Levels for XBTUSD Curncy (Date: 2025-04-05)
==================================================
Daily Range: 1277.71
Resistance Levels (Above Open):
------------------------------
R5: 87053.99 | Offset: +2924.26
R4: 85063.92 | Offset: +934.19 *
R3: 84736.57 | Offset: +606.84 *
R2: 84610.23 | Offset: +480.50 *
R1: 84290.78 | Offset: +161.05 *
------------------------------
Open Price: 84129.73
------------------------------
Support Levels (Below Open):
------------------------------
S1: 84128.87 | Offset: - 0.86 *
S2: 83969.35 | Offset: -160.38 *
S3: 83902.63 | Offset: -227.10 *
S4: 83517.64 | Offset: -612.09 *
S5: 83190.29 | Offset: -939.44 *
==================================================
* Denotes intraday level, likely tested
In the top panel, the total impulse of macro drivers and positioning is illustrated in its strength. The greater the strength in the move, the higher the probability and amplitude of the move that is likely to take place. The bottom panel illustrates if the skew is either bullish or bearish probability.
Bitcoin was up on the day today as ES had one of its worst trading sessions. When we take this along with the other macro and positioning drivers, the upside in Bitcoin has significantly increased on a short-term basis as the strategy lays out.

(The US Macro Liquidity Driver contribution identifies HOW the drivers of US liquidity are contributing to the returns of Bitcoin. In the same manner, the higher the contribution moves, the more strength the drivers have in pushing Bitcoin in a specific direction.)

(The Bitcoin Risk Premium Driver contribution identifies HOW the risk premium of Bitcoin is contributing to returns. In the same manner, the higher the contribution moves, the more strength the drivers have in pushing the Bitcoin in a specific direction.)
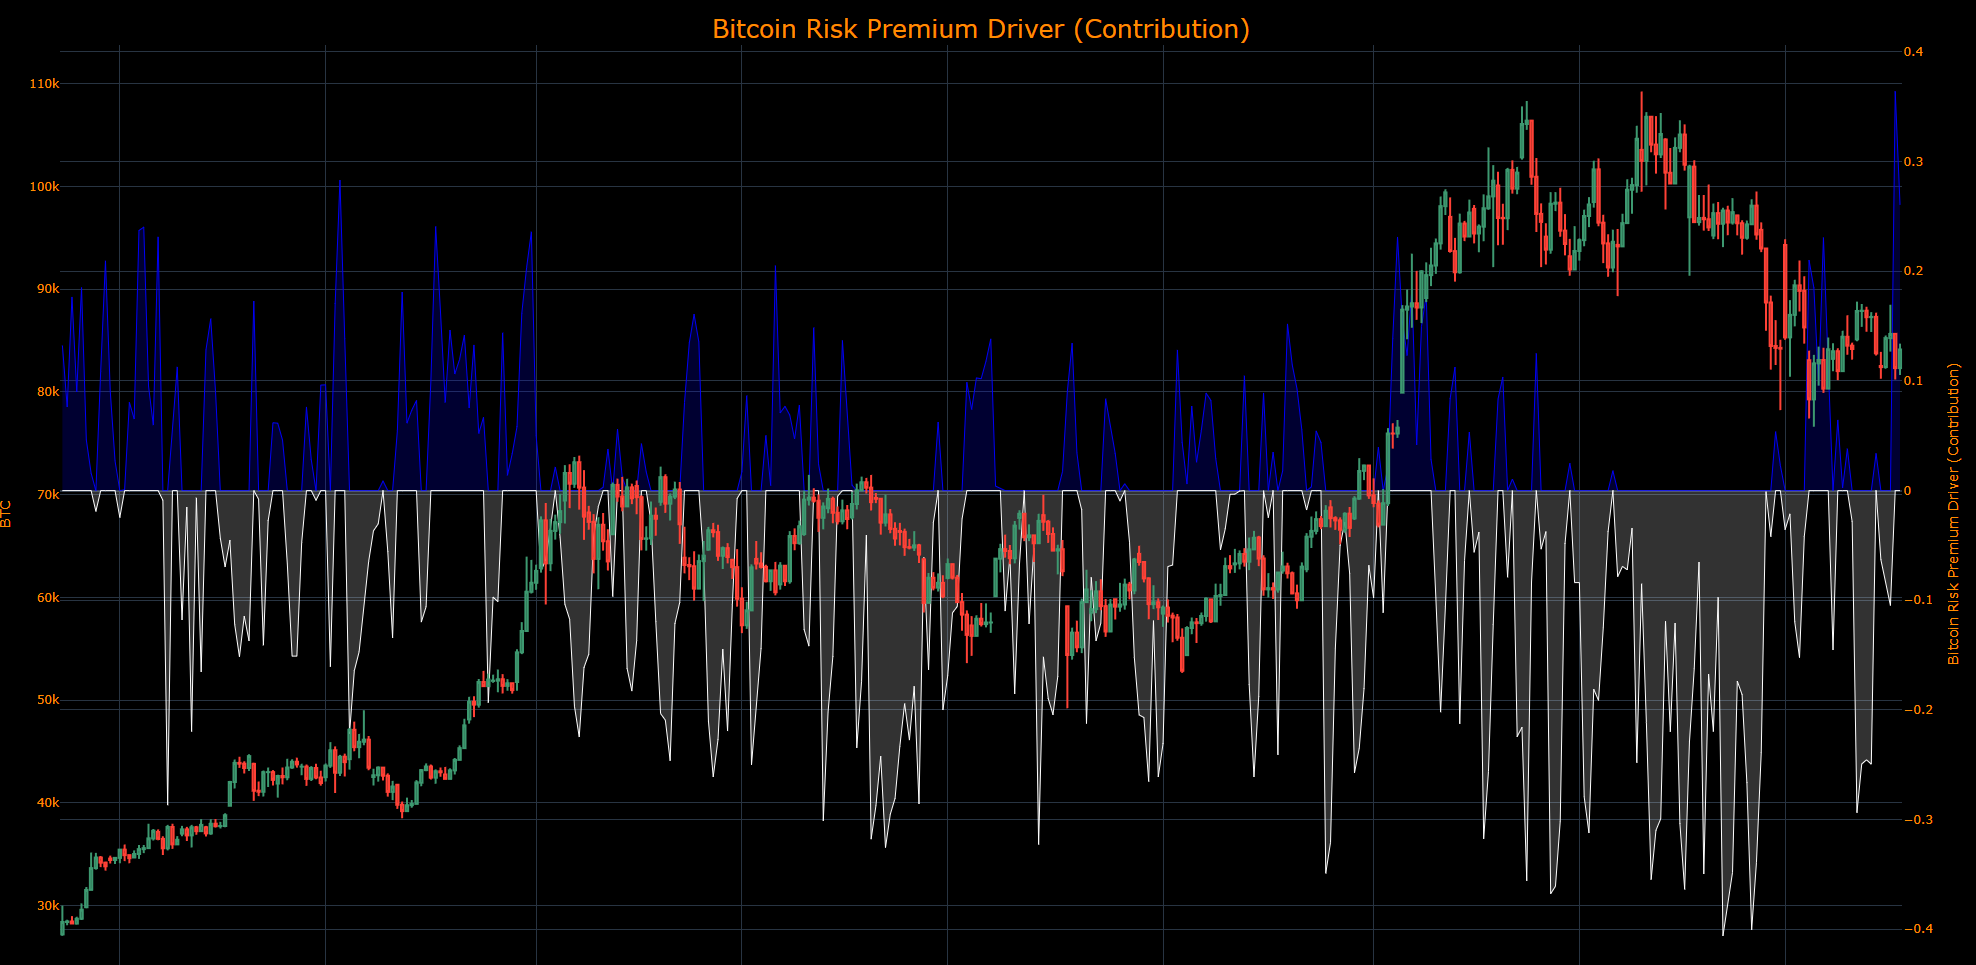
(The Dollar Liquidity Driver contribution identifies HOW the drivers of dollar liquidity are contributing to the returns of Bitcoin. In the same manner, the higher the contribution moves, the more strength the drivers have in pushing Bitcoin in a specific direction.)

(The Global Liquidity Driver contribution identifies HOW the drivers of global liquidity are contributing to the returns of Bitcoin. In the same manner, the higher the contribution moves, the more strength the drivers have in pushing Bitcoin in a specific direction.)

Final Note:
It is important to remember that ranges and volatility in markets are incredibly elevated. Action should be taken incrementally and cautiously. I will be breaking this down further in reports over the weekend, but everything is setting up for some amazing trade opportunities between now and the next FOMC meeting.

If you are trying to understand these drivers, I suggest you go through all the Macro Alpha Primers:
Macro Alpha Primers:
Macro Alpha Primer: Credit Risk and Duration Risk and Macro Podcast: Macro Alpha Primer
Macro Alpha Primer: Correlations and Macro Podcast: Macro Alpha Primer
Macro Alpha Primer: Macro Catalysts, Hedging Pressure, and Positioning and Macro Podcast: Macro Alpha Primer
Macro Alpha Primer: Positioning Premiums and Macro Podcast: Macro Alpha Primer
As always, a Pepe for the culture: don't get caught up in the sentiment of the crowd

The information on this website/Substack is for information purposes only. It is believed to be reliable, but Capital Flows does not warrant its completeness or accuracy. The information on the website/Substack is not intended as an offer or solicitation for the purchase of stock or any financial instrument. The information and materials contained in these pages and the terms, conditions and descriptions that appear, are subject to change without notice. Unauthorized use of Capital Flows websites and systems including but not limited to data scraping, unauthorized entry into Capital Flows systems, misuse of passwords, or misuse of any information posted on a site is strictly prohibited. Your eligibility for particular services is subject to final determination by Capital Flows and/or its affiliates. Investment services are not bank deposits or insured by the FDIC or other entity and are subject to investment risks, including possible loss of principal amount invested. Your use of any information which is proprietary to Capital Flows or a third-party information provider shall only be used on individual devices without any right to redistribute, upload, export, copy, or otherwise transfer the information to any centralized interdepartmental or shared device, directory, database or other repository nor to otherwise make it available to any other entity/person/third party, without the prior written consent of Capital Flows.
I'm yet to meet someone with your work ethic 🔥🔥🔥
Hi Cap, thanks for the content, amazing stuff as always. Will there be a article on how you build the drivers for each one?