

The Research Hub: Mean Reversion and Model Risk
Momentum and mean reversion connecting to risk metrics

Hello everyone,
In this article, I am going to breakdown the importance of building models on both a mental basis and a quantitative basis. I will then show how this process is tangibly applied to the current price action we are seeing in the S&P500 price action.
The main idea to remember for this topic is that you want to systematize your highest quality thinking in order to minimize your margin for error as you move through various market environments and degrees of personal mental clarity.
Let’s start with a few big-picture presuppositions
First, precise and exceptional action requires high-quality clear thinking.
Second, we always think we will perform better during a crisis than we actually do. This is called “the fog of war.”
Third, we have varying degrees of performance and mental clarity depending on the environment.
Fourth, as we interact with greater levels of complexity, we need to move to higher levels of thinking. For example, we use spreadsheets or calculators to offload specific cognitive actions that could take energy from higher-level thinking.
Fifth, building processes or models that channel the cognitive energy and mental focus empowers an individual to achieve their highest quality thinking. However, the risk is mistaking the map of the terrain and falling into the trap of Platos Cave.
Plato's Allegory of the Cave, found in his work "The Republic," depicts prisoners chained inside a dark cave, only able to see shadows cast on a wall by objects passing in front of a fire behind them. These shadows represent the prisoners' limited perception of reality, much like how models and projections can be mistaken for the real dynamics in financial markets. When one prisoner escapes and sees the outside world, he realizes the shadows are mere illusions, and true knowledge comes from understanding the higher realities outside the cave. This allegory illustrates Plato's theory of Forms and serves as a powerful metaphor for the financial world, where market participants often confuse models (the shadows) for the underlying economic realities (the true forms). It emphasizes the philosopher's journey towards enlightenment and deeper truths, analogous to an investor’s quest to see beyond data and forecasts to grasp the genuine market forces at play.
Presuppositions Into Action:
Now that we have the presuppositions context or the WHY behind models matter, we can begin to ask, WHERE should we begin building models? See all of my educational article on this here:
Research Synthesis / Direction Of Capital Flows Substack

Hello everyone, There has never been a time in history when understanding the world from a global perspective and interpreting it accurately paid such a high premium. Since the very beginning of this Substack, I have talked about the nature of the time we live in and how to act intentionally in it.
Personally, I build out processes and models for almost every aspect of markets and my actions in them. As I laid out in the macro podcast, in order to generate exceptional returns, you need to use leverage which means a very SMALL margin for error.
Macro Podcast: How to generate exceptional returns

Hello everyone, I put together a presentation on how to think about the industry as a whole and the path to generating exceptional returns. All of the educational articles are here: Check out the books and people I referenced: Prometheus Research and their website:
This could be as simple as a checklist process for reading books and academic papers all the way down to systematically quantifying intraday price action. I have spreadsheets structured for all research and strategy development that I’m building.
Let me just say this, everyone wakes up one day and just thinks to themselves, “What if the market is just going to dump off a cliff and I lose my entire net worth?” That’s called being normal. The question is how do you respond to this thought? Do you walk over to your computer and move to cash or do you consult all your models to examine whether your intuition has validity?
There is actually a great book on this topic called “Educating Intuition.” Intuition or gut feeling is not something you want to suppress. It is something you want to channel into a preexisting framework that can fully extract the value it provides. This really brings us to the question of the signal quality of either quantitive models or pure intuition. This is a great section from this book noted in the interest rate primer: Link

Tangible Examples:
I have laid out how regimes and risk management function in these articles:
Let’s take the S&P500 price action we have been seeing. Big picture, we remain in a positive momentum regime without a significant macro driver indicating an inflection point (see this paper for model: Link).

The chart below shows standard deviation extremes on the upside (green) and downside (red) with weekly OHLC levels noted by the lines.

The goal is to have mental models or quantitive models on each decision-making process so that our highest quality thinking can be channeled to its full potential. For example, we can create very simple conditional clauses for actions using these specific levels or standard deviation extremes.
You will notice we had three bearish standard deviation extremes in a row BELOW the weekly levels:
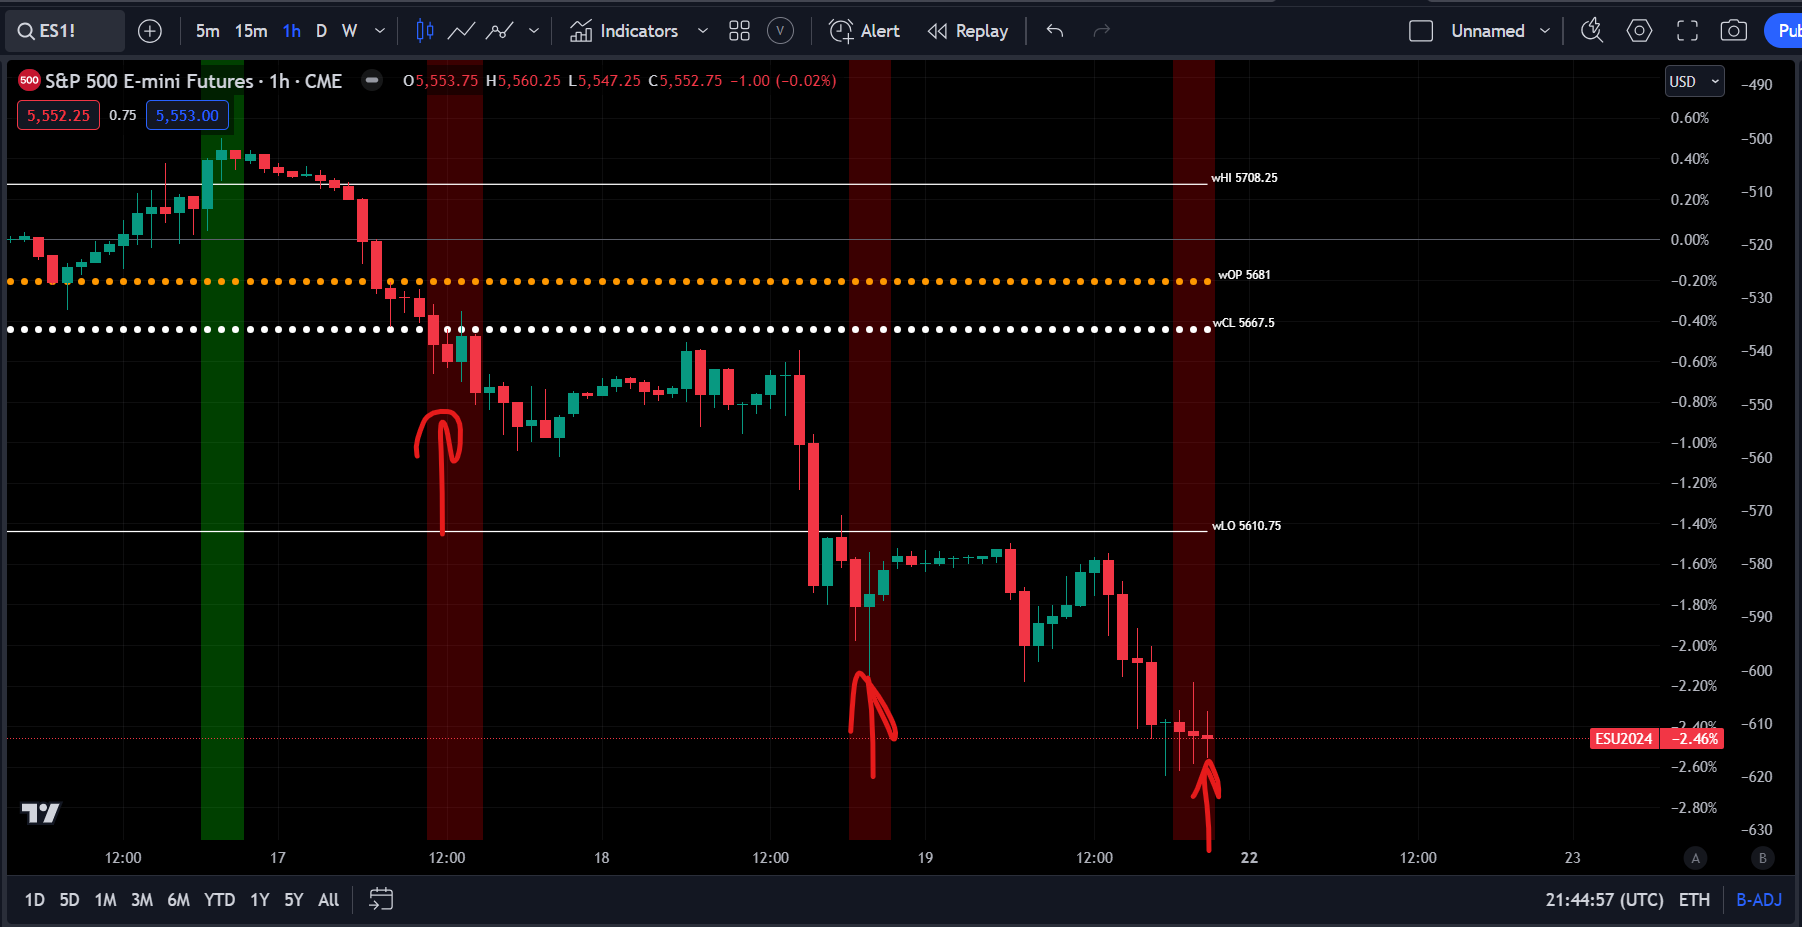
While these aren’t the inputs that go into my ES strategy, you can begin to see HOW to aggregate data points for signals and thereby action. See the ES trade here:
Trade: Closing ES Long

Hello everyone, We have had huge success in the ES long thus far: The time has come to derisk and wait. I opened the trade here and am closing the trade here (see yellow lines): I laid out the positioning unwind here. Here is the deal: we don’t have a macro driver for the selling right now but we could price a much higher premium in positioning. This me…
The bigger question is how do we synthesize all of the macro variables, correlation, volatility complex signals and capital flows into action? There is a lot more that goes into the price action of ES than the technical levels or standard deviation ranges.
It is this real-time synthesis aligning macro flows, a technical edge and positioning that can generate an informational edge. This is what I will be breaking down in the S&P500 write up tomorrow for paid subscribers. Be on the lookout for it. When my ES strategy triggers another long (or even a short), I will be sharing it.
It is periods of time like this where understanding macro flows and positioning is critical. This doesn’t imply we will always get it right but you can review my ES breakdowns YTD in this article:
Macro Report/Insights: ES levels and macro flows

Humans fear what is unseen far more than what is seen Embracing what is unseen and unknown is the ONLY way to achieve superior returns in financial markets. The problem with this simple concept is that it’s incredibly difficult. People hate difficulty, uncertainty, and the unknown.
And obviously, in the ES trade, I just closed before the additional selling we saw this past week: Link Open and close signals marked by yellow lines:

See my global macro end-of-week commentary here: Link
We will be moving forward into next week with a lot of research and trades on the Substack. Be ready!

How do you organize all of the macro variables, charts, correlations, volatility complex signals, etc?