

Macro Report/Insights: ES levels and macro flows
The liquidity release valve is in play

Humans fear what is unseen far more than what is seen
Embracing what is unseen and unknown is the ONLY way to achieve superior returns in financial markets. The problem with this simple concept is that it’s incredibly difficult. People hate difficulty, uncertainty, and the unknown.
A very simple example of this is that it is so much easier to conceptualize a market correction than a market melt-up. If I say, “You know there are a lot of risks in the economy right now and we are about to head into a bear market similar to 2022” and then show you this chart, what is your reaction?

It seems plausible. There are a lot of risks and there is a frame of reference from previous price action.
Inversely, if I shared this chart and said we are going to rally because the economy isn’t falling apart, you’d probably be more skeptical.

We always hear excuses like, “Well we just haven’t ever seen these types of all-time highs before.” (news flash, an all-time high is always new)
In reality, the bear market extrapolation in the first chart is a copy of the price action from 2022. The bullish extrapolation in the second chart is the price action since October 2023. Both of these extrapolations are things that took place in the past. The bearish one seems more plausible to the human eye though. Why? Because we can see past price action as a frame of reference. The bullish price action up and to the right is into the unknown.
This dynamic results in everyone underestimating the right tail risk in markets. Listen, all of us know there can be a market crash. The entire option market is there to provide insurance for a market crash on the left tail (hence the constant skew). But how often do you hear people talking about “right tail risk.” Never!
You will consistently see this over and over through the financial industry. This is actually part of the reason isolation from the financial industry isn’t a horrible idea.
This underestimation of the right tail in equities contextualizes the macro flows we have been seeing and are likely to see moving into Friday of this week.
Equities Trade:
I have been explicitly bullish on equities this whole year. This is an excerpt from my report in January (link):

I was explicitly bullish and showed that both of these dips in ES were significant buying opportunities:

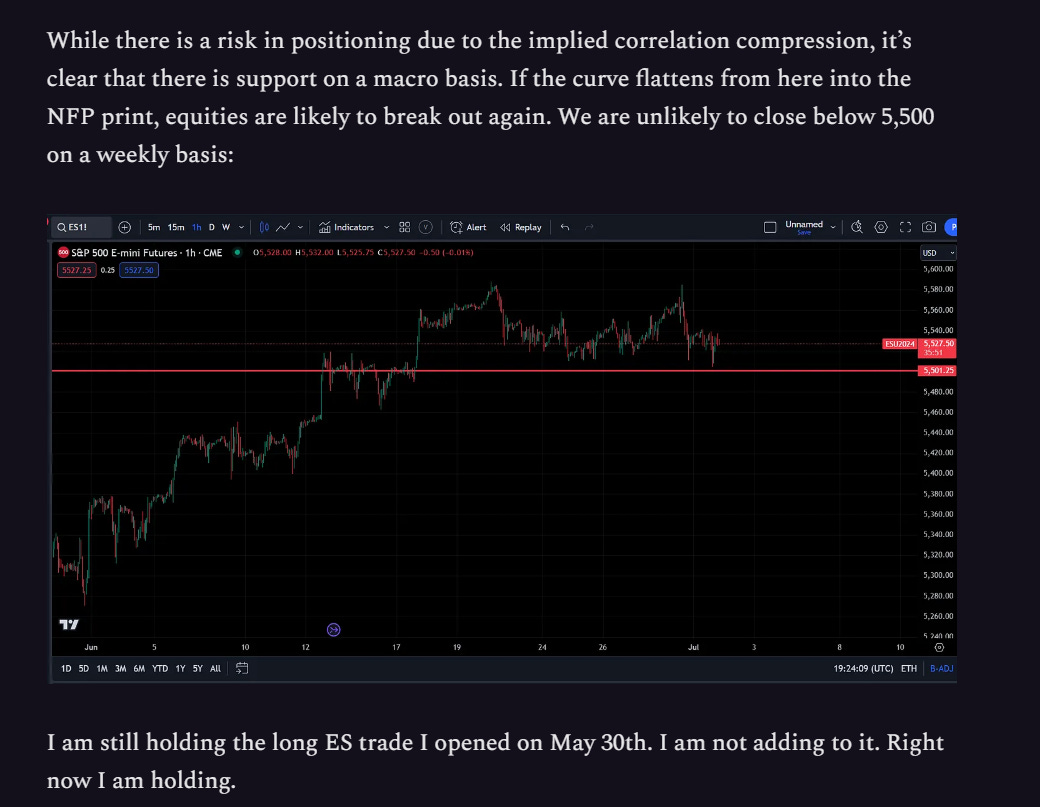
Last night I noted that we were unlikely to break below 5,500 and that the skew was to the upside: Link
As we entered the trading day this morning, it was very likely that we rallied significantly based on the intraday models I run:

If you want to dig into these more, read both of the reports I wrote on equities for the regime and the intraday trading primer:
Ok cool, so you nailed equities this year. What’s next?
This week:
The current trades I am running have been noted in these articles:
The main thing I want to touch on here is how ES is functioning after today’s price action.
We are in this short-term range where volatility has been compressing. ES price action has been mean reverting between the standard deviation ranges. This mean reversion functions as a liquidity provision mechanism for larger players as they adjust their positioning.

Notice how this move down in ZN couldn’t cause ES to make a lower low on a standard deviation basis? Why is this? This is because the downside for ZN is limited.
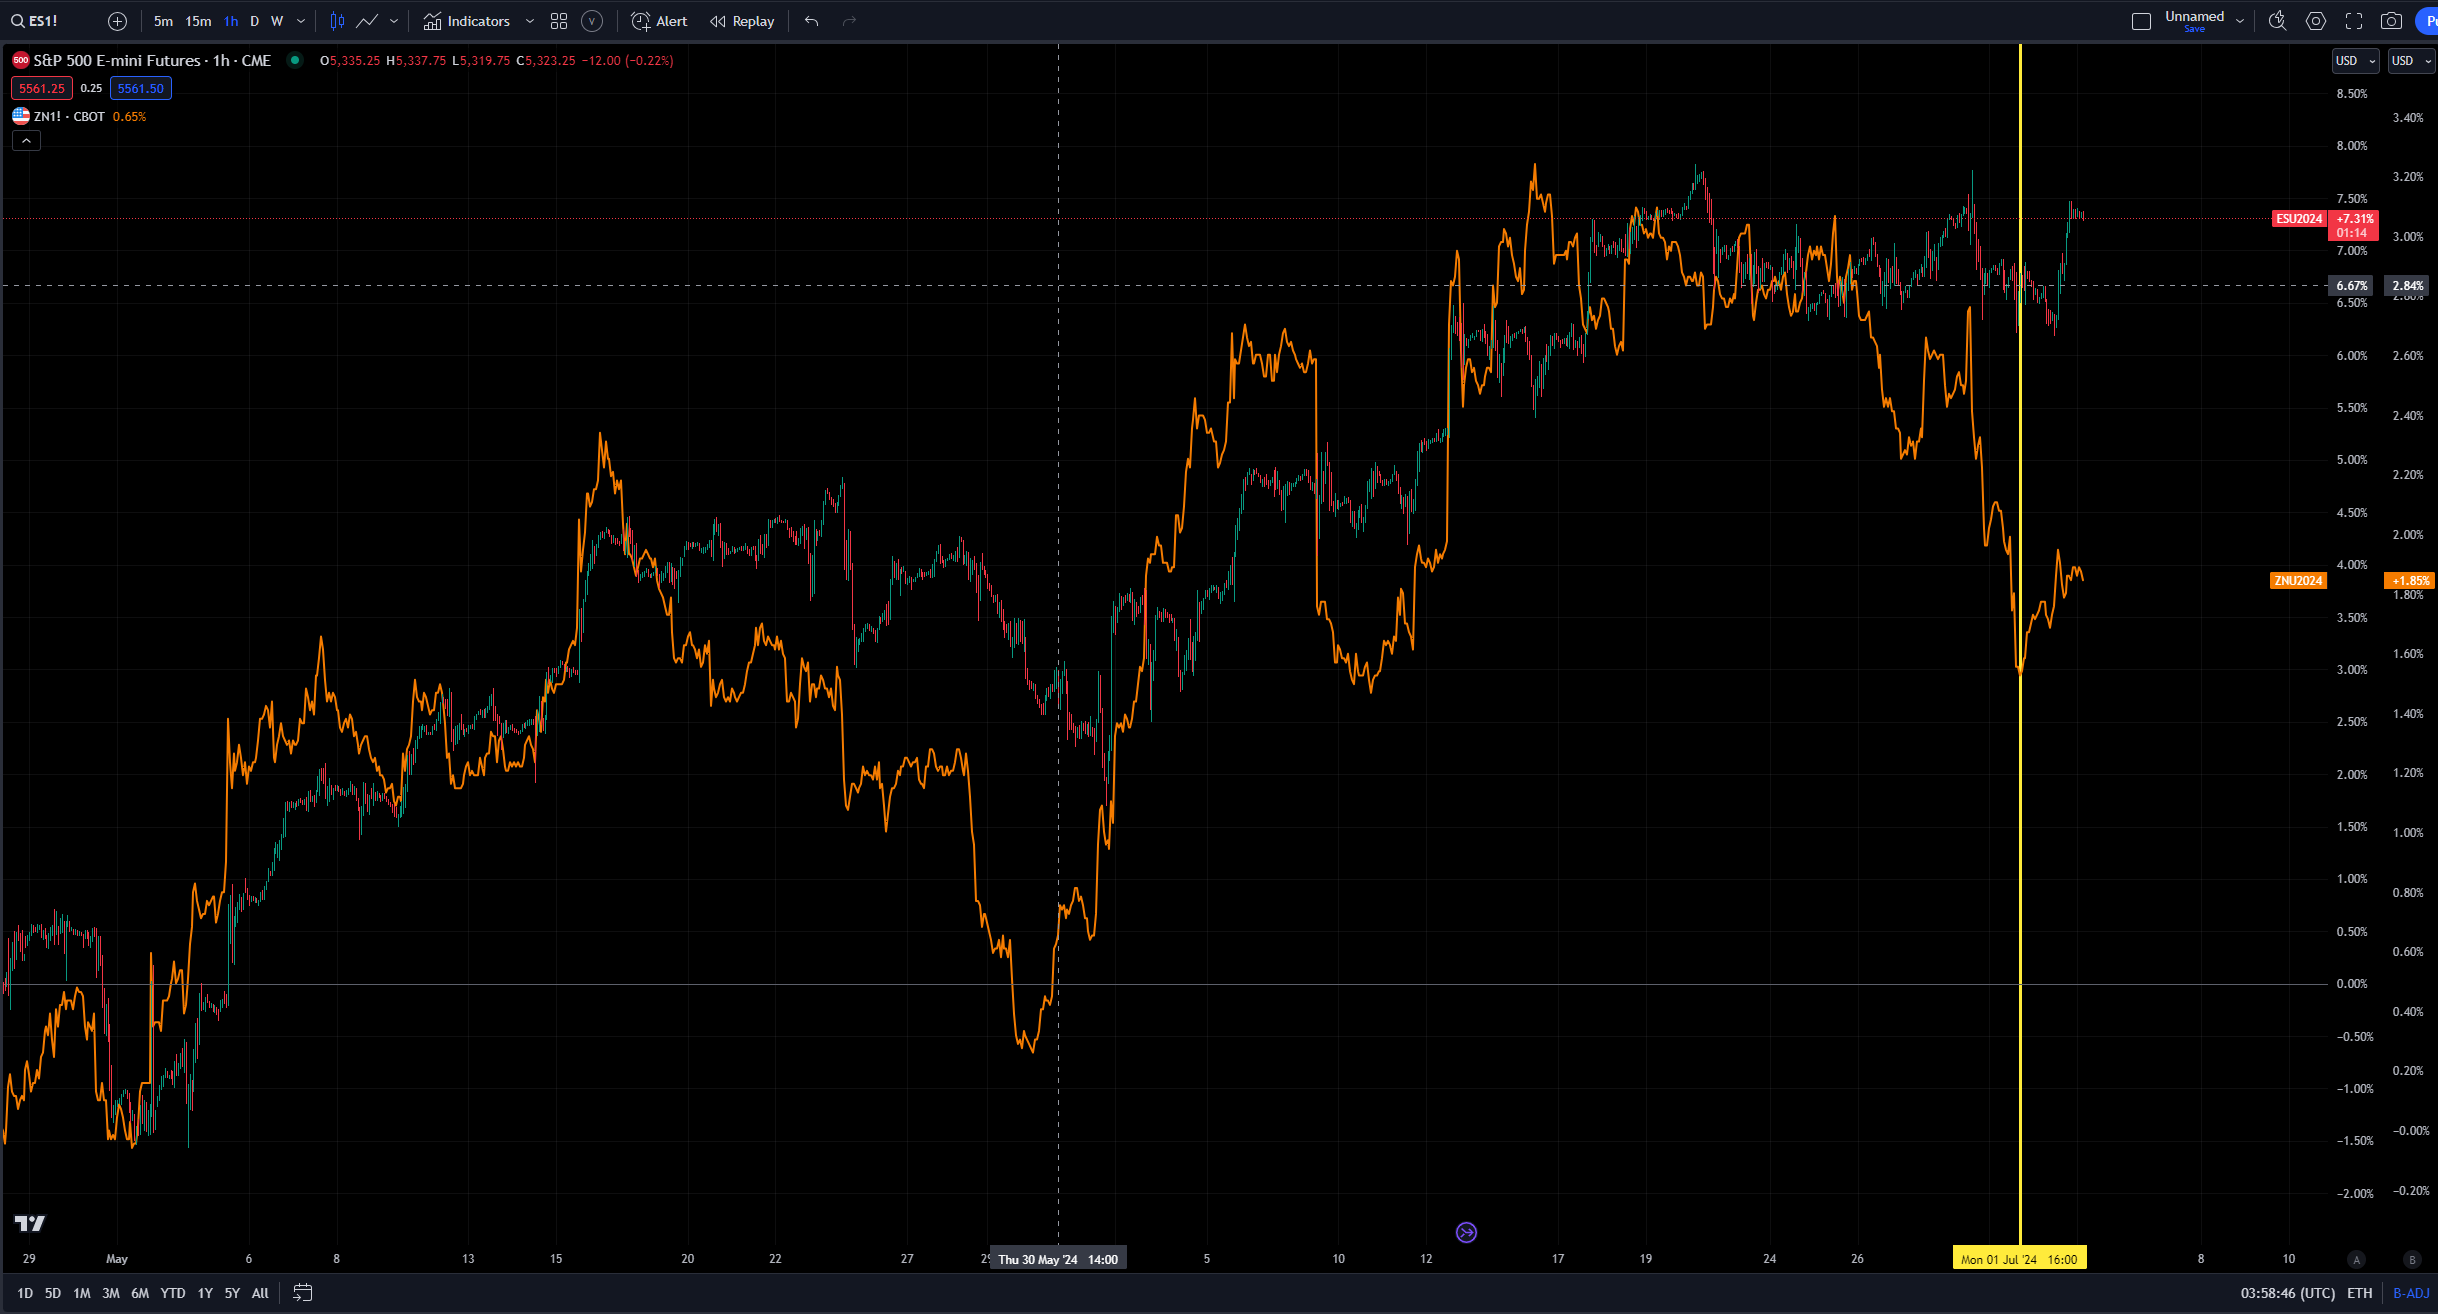
People are going to provide you with all of their elaborate arguments but at the end of the day, the downside for bonds here is limited. I laid out my views on the short end and long end of rates in the macro report:
Comprehensive Macro Report

All of the research on interest rates and equities has been provided. I continue to hold the long ES trade published May 30th noted here: Here are the links to all the main pieces I have done recently explaining the tensions of the macro situation. Equity Report:
Fundamentally though, if bonds aren’t moving down and growth is resilient, we have a Goldilocks situation where stocks and bonds can rally together. When will this take place? It is very likely to be on the NFP report this week or next week’s price action.
Notice that the unemployment rate is expected to remain constant and the jobs number is expected to decelerate:

All we need is for the NFP print to not come in significantly above expectations for confirmation to stocks and bonds that Goldilocks price action can continue.

Watch the curve within this logic because if we bear steepen above -0.280% then we could see a retracement of the ES price action that took place today. If we bull steepen above that level or bull flatten then ES is very likely to be supported by macro flows.

If all of these dynamics with rates are new, check out the interest rate primer or comprehensive breakdown of all the educational primers I have written thus far:
Pulling Things Together:
The most important thing you can do for success in markets is to understand the logic for WHY things are moving in the way that they are. This contextualized knowledge is what equips you to adapt on the fly. This is why I spend so much time explaining the tensions and logic behind things. It would be easy for me to just post trades and walk away. It is more difficult to explain why you do what you do.
If all of this is very new to you, that is completely fine. Spend some time reading all of the previous articles and recommended books noted on the Substack. This will be difficult but help you considerably.
“You wasted $150,000 on an education you coulda got for $1.50 in late fees at the public library.”
I will be sharing additional analysis and trades this week for paid subscribers but for now, I am holding the long ES trade (link) and posting Pepe’s!
