

Trades: Bitcoin and Bonds
Macro Liquidity and duration risk

One of the most difficult things for “smart” people to do is this:
"When I see a bubble forming I rush in to buy, adding fuel to the fire. That is not irrational."
-George Soros
Big Picture:
The macro view for Bitcoin continues to be explicitly clear. I opened a BTC long at $57,150 and it is in the money now (link):

Bitcoin functions as a liquidity release valve for the real purchasing power of dollars as they relate to the price and quantity of money in the system. There isn’t any indication that a high degree of goods and services are being transacted through Bitcoin which would result in a fundamental constraint on the tradable float. As a result, macro liquidity remains the primary driver. I have laid out these dynamics here:
Bitcoin Strategy: The Macro Liquidity Release Valve

Welcome to the promised report on how to analyze and trade Bitcoin. The difficulty of operating in today’s world is not primarily one of obtaining data but more about thinking and interpreting data correctly. On top of this, your interpretation of the data must correctly align with the temporal tensions that exist. This is why I always say:
As macro liquidity expands, the price of Bitcoin is pushed up. As macro liquidity decreases, Bitcoin moves down. Within this mechanism, positioning is trying to extract returns and sometimes there are idiosyncratic drivers moving the price. For example, we have had a positive trend in Bitcoin YTD and then it has been range-bound since April:

Notice that Bitcoin has deviated from broad risk assets as there was some short term selling pressure due to Germany selling, Mt Gox, and the US government selling. All of these selling pressures were by definition short term in nature and causing a technical pull back within a bullish trend supported by macro liquidity.

Macro liquidity is in the process of increasing as real rates move DOWN:

This is why we have seen Bitcoin and gold rally TOGETHER:

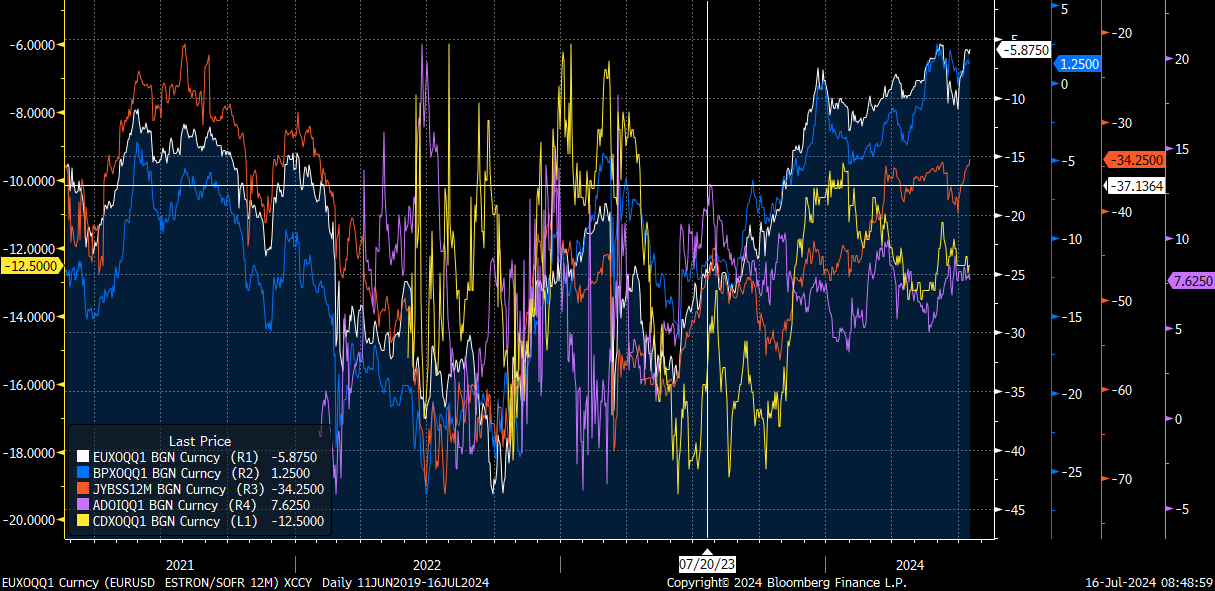
As real rates continue to drop, we continue to see cross-currency basis swaps hold highs. In simple terms, line in chart go up=macro liquidity up (conks is going to kill me for such a reductionistic statement). See Concoda work for more on this.
On top of this, we continue to see cross-asset class implied vol remain suppressed:

The move index keeps trending down:

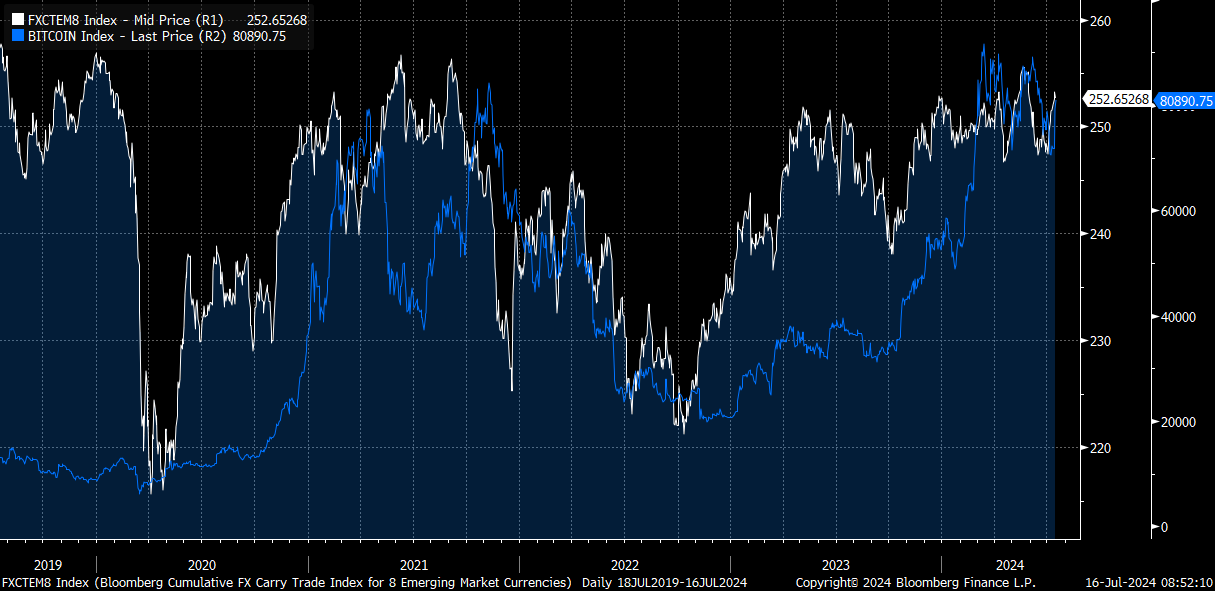
And the carry trade index continues to move up. This has moved in lockstep with Bitcoin for a while now:
The implication of these datapoints is that macro liquidity remains skewed to the upside. As I have laid out in all the recent reports, when you have rate cuts into resilient growth, this is a huge positive liquidity impulse:
Equity Report: Link
Comprehensive Macro Report: Link
Alpha Report: Rates, Equities, Catalysts: Link
Critical Signal: Rates and Equities: Link
All My Equity Signals/Research YTD: Link
Current Trades: Link
Trades/Week Ahead: Inflation and Rates: Link
Interest Rate Report: Duration, TLT, and the macro cycle: Link
Macro Podcast: Rates, Recession, and Risk Assets: Link
Trades: CPI and PPI Update: Link
Macro Inflection Points: Momentum Turning Points: Link
How to think about things moving forward:
Mapping the speed of rate cuts as they relate to the changes in growth and inflation is HOW to interpret the price action of Bitcoin into the end of the year. I laid this out in a twitter thread here: Link
Once the expectation of a September cut is realized, the market will look forward to HOW MANY cuts should be priced in 2025.

There is a reason why Bitcoin and gold have begun to tighten their correlation with the December 2025 SOFR contract. The number of rate cuts in 2025 will determine the price of money in the system and thereby cause Bitcoin to price the differential as a liquidity release valve.

Now you can begin to see why understanding interest rates is so important for Bitcoin.
And this leads us to interest rate views!
Bond Update:
I am going to lay out the views and trades I have shared thus far and further explain what is likely to happen as we move into the end of 2024.
Keep reading with a 7-day free trial
Subscribe to Capital Flows to keep reading this post and get 7 days of free access to the full post archives.